


How To Solve System Of Linear Equations Graphically With Steps And Examples
The mathematical expressions of variables and constants along with the mathematical operations form an equation of the highest degree one. When plotted on a graph, a linear equation is an algebraic equation between variables that produces a straight line. A linear equation of one variable is of the form ax + b = 0 where x is the variable. Linear equations of two variables are of the form ax + by + c = 0 where x and y are the two variables and c is the constant. A pair of linear equations can be solved and represented using two basic methods: the graphical method and the algebraic method. In this article, we are going to learn about solving linear equations graphically.

Examples of Linear Equations
System of Linear Equations
A group of more than one linear equation is commonly known as a system of linear equations. For solutions, we can solve the system of linear equations graphically.
Solving Linear Equations in Two Variables
The solution to linear equations comes in a pair (x, y), one value for the variable x and one value for the variable y. Thus, the solutions for any linear equation in two variables in the form ax+by-c = 0 represent a particular point on the cartesian plane. The graph of a linear equation is always a straight line, no matter what the solutions are.

System of Linear Equations
How to Plot the Equations on a Graph
If there is one point of intersection, there is one solution. The x and y coordinates of the point of intersection are the values for the variables that are common between the two equations.
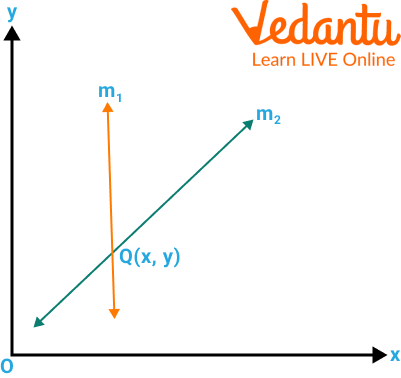
One Solution
If the lines coincide, then there are infinitely many solutions.

Many Solution
If the lines are parallel, there is no solution.
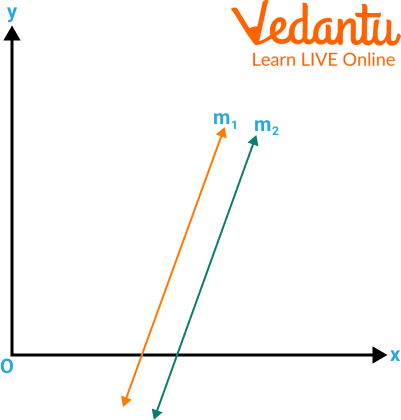
No Solution
Solved Example
1. Check whether the equation $y = 5x + 4$ is linear or not.
Ans: An equation is considered linear if it is in the form of $y=m x+b$ where $\mathrm{m}$ is the slope of the equation and $\mathrm{b}$ is the $\mathrm{y}$-intercept.
Here, $x$ can only be to the power of one.
Since $y = 5x + 4$ is in the form of $y=m x+b$ and x is having power 1. Therefore, the equation is linear.
2. Check whether the equation $y=3 x^2+1$ is linear or not.
Ans: Here, the power of x is more than 1. And for linearity, the power should be 1. Hence, the given equation is not linear.
3. What are the variable and contents in the given equation: $\dfrac{1}{\sqrt{2+x}}=1$
Ans:
Variables: x
Constants: 2
Practice Questions
1. Check whether the equation $y = 9x + 10$ is linear or not.
Ans: Linear
2. Check whether the equation $y=2 x^5+10$ is linear or not.
Ans: Not Linear
3. Check whether the equation $y=4 x^2+ z$ is linear or not.
Ans: Not Linear
Summary
A linear equation is in the form of ax+by+c=0, where a and b are not equal to zero. A linear equation in two variables is an equation that contains two variables (x, y) and the highest degree of the equation is 1. A group of more than one linear equation is known as a system of linear equations. The solution to a system of linear equations in two variables can be found by solving the system graphically. To solve it graphically, the equations have to be graphed individually and then their point(s) of intersection determines the common solution.
FAQs on Solving a System Of Linear Equations By Graphical Method
1. What does it mean to solve a system of linear equations graphically?
To solve a system of linear equations graphically means to find the point of intersection of the lines representing the equations on a graph. Each linear equation is drawn as a straight line on the coordinate plane, and the solution is the ordered pair (x, y) where both lines meet. This point satisfies both equations simultaneously. If the lines intersect once, there is one solution; if they never intersect, there is no solution; if they overlap, there are infinitely many solutions.
2. How do you solve a system of linear equations by graphing step by step?
You solve a system of linear equations graphically by plotting both equations and identifying their intersection point. Follow these steps:
- Rewrite each equation in slope-intercept form: y = mx + c.
- Plot the y-intercept (c) on the graph.
- Use the slope (m) to draw the line.
- Repeat for the second equation.
- Locate the point of intersection; this ordered pair is the solution.
Example: For y = x + 1 and y = 2x − 1, the lines intersect at (2, 3).
3. What is the solution of a system of linear equations on a graph?
The solution of a system of linear equations on a graph is the ordered pair (x, y) where the two lines intersect. This point satisfies both equations at the same time. For example, if two lines intersect at (3, −1), then x = 3 and y = −1 solve both equations.
4. What happens if the two lines do not intersect when solving graphically?
If two lines do not intersect, the system has no solution. This happens when the lines are parallel, meaning they have the same slope but different y-intercepts. Example: y = 2x + 1 and y = 2x − 3 are parallel lines and never meet, so the system is inconsistent.
5. What does it mean if two linear equations overlap on a graph?
If two linear equations overlap completely, the system has infinitely many solutions. This occurs when both equations represent the same line. Example: y = 2x + 4 and 2y = 4x + 8 simplify to the same equation, so every point on the line is a solution.
6. Can you give an example of solving a system of linear equations graphically?
Yes, solving graphically means plotting both lines and finding their intersection point. Example:
- Equation 1: y = x + 2
- Equation 2: y = −x + 4
After graphing both lines, they intersect at (1, 3). Therefore, the solution to the system is x = 1 and y = 3.
7. What are the possible types of solutions when solving a system graphically?
A system of linear equations solved graphically can have one solution, no solution, or infinitely many solutions. These cases are:
- One solution: Lines intersect at one point.
- No solution: Lines are parallel and never meet.
- Infinitely many solutions: Lines overlap completely.
These correspond to consistent independent, inconsistent, and consistent dependent systems.
8. Why is slope important when solving systems of linear equations graphically?
Slope determines whether two lines will intersect, be parallel, or coincide. If two lines have:
- Different slopes: They intersect once (one solution).
- Same slope, different intercepts: They are parallel (no solution).
- Same slope and intercept: They overlap (infinitely many solutions).
Thus, comparing slopes helps predict the type of solution before graphing.
9. Is solving a system of linear equations graphically always accurate?
Solving a system graphically may not always give an exact solution unless the intersection point lies exactly on grid points. Small drawing or scaling errors can lead to approximate values. For precise answers, algebraic methods like substitution or elimination are often more accurate.
10. What are common mistakes when solving systems of linear equations graphically?
Common mistakes include plotting points incorrectly and misreading the intersection point. Avoid these errors:
- Not rewriting equations in y = mx + c form correctly.
- Plotting the y-intercept incorrectly.
- Using the wrong slope direction (rise/run).
- Estimating the intersection point inaccurately.
Careful graphing ensures the correct solution to the system of linear equations.