


How to Use a Perimeter Chart with Shape Formulas and Solved Examples
In mathematics, area and perimeter are the two important properties of any shape. It is used in our day-to-day lifestyle. The region enclosed by an object's shape is called the area. The shape's area can also be described as the area in a plane covered by a figure or any geometric shape. The dimensions and qualities of any shape determine its surface area.
Different shapes have different regions, each of which can be defined differently. The whole distance surrounding a figure is referred to as its perimeter. In a two-dimensional plane, a shape's perimeter is its entire circumference. Depending on their measurements, different shapes' perimeters may be equal in length.
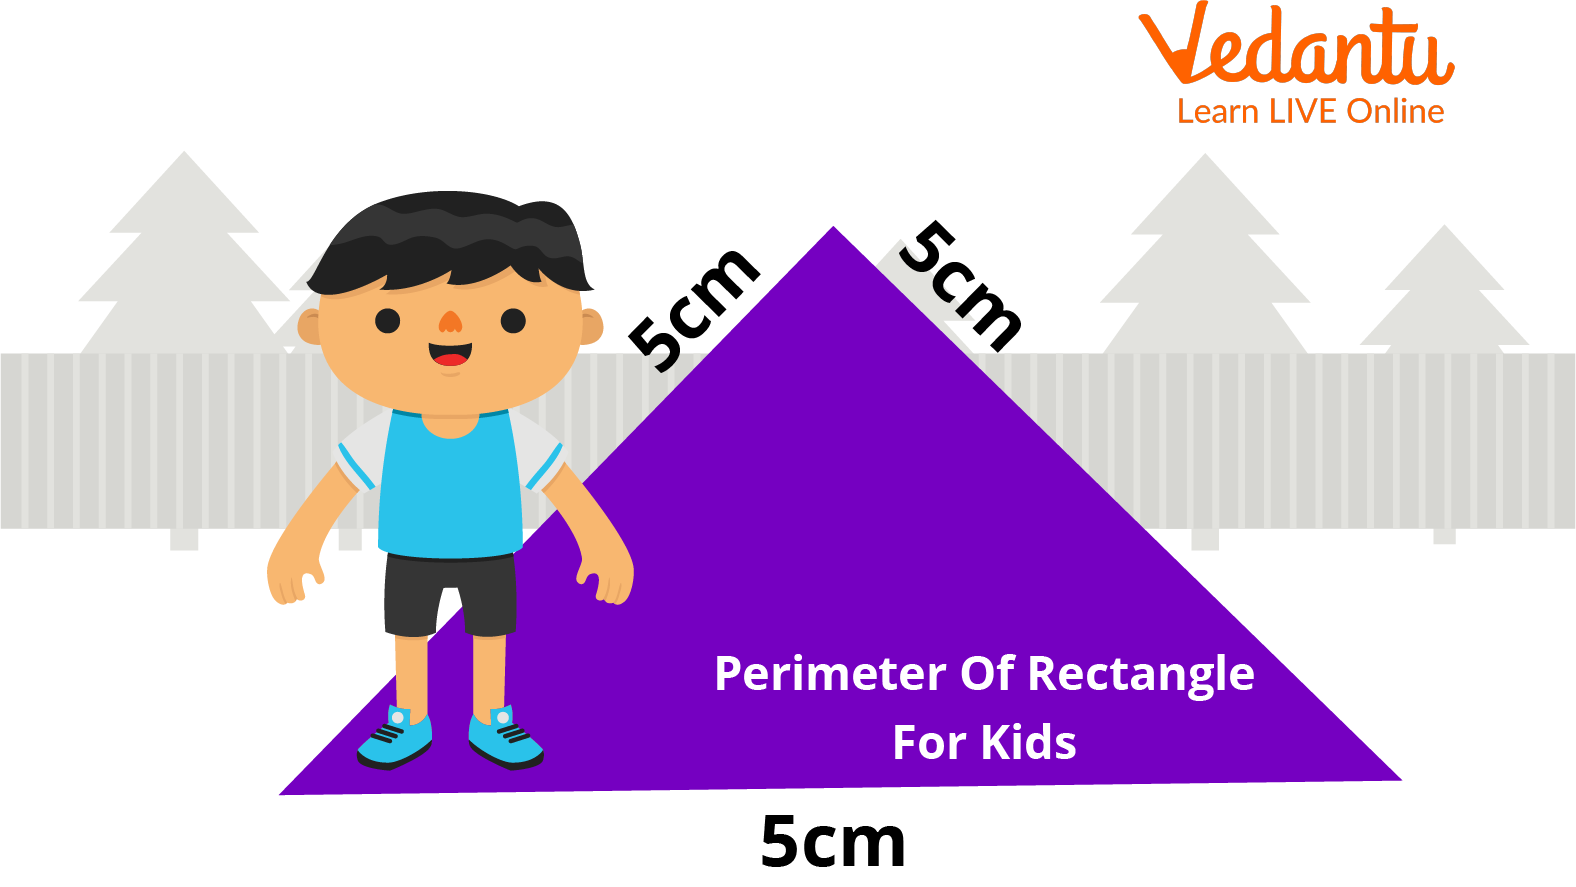
Perimeter
Square Line Page:
It is a coordinate paper and grid paper. It is a type of writing paper printed with tiny lines forming a consistent grid. The lines are often used as a guide when producing graphs of functions or experimental data and sketching curves. It is frequently used in laboratory notebooks, as well as in mathematics and engineering education. Graph paper can be purchased either loose or bound in notebooks. Most graph paper pages have dimensions of 8.5 inches wide by 11 inches long.
Square line page
Different types of square line paper:
The different types of graph paper are:
Grid Paper:- The widely used graph paper, on which students frequently plot or draw experimental data, curves, etc., is quite similar to grid paper. As the name implies, grid graph paper is mainly composed of regular grids, also known as standard lines in layman's terms.
Quad Graph Paper:- This graph paper is referred to as the first kind of graph paper used, also known as quadrille graph paper. It is derived from French. The paper is grey and light blue in tone. Using a light grey hue, the grids are created. Usually made up of two to five blocks, quad graph paper displays smaller amounts of data.
Engineering Graph Paper:- This graph paper is mainly for engineering-related tasks. The sheet of paper has ten grids and is bright green. Each page has a margin. This paper is mainly used to demonstrate a well-done job.
Millimetre Graph Paper:- This graph paper is used for drawing tasks. Ten squares, each measuring one centimetre, make up the graph paper.
Hexagonal Graph Paper:- The field of the geometric diagram uses this graph paper. The various structures are depicted on the graph.
Dot Graph Paper:- Dot graph paper is simply another type of graph paper with a unique application among academics and professionals. Dot paper, frequently used for bullet journaling, drawing, etc., can be broadly defined as paper with dots spaced regularly across it.
Conclusion:
A perimeter is a closed path that surrounds, encircles, or outlines a two-dimensional shape or a one-dimensional length. The perimeter is measured in unit. The perimeter chart of different figures is given below:
FAQs on Perimeter Chart for Common Shapes and Formulas
1. What is a perimeter chart in Maths?
A perimeter chart is a table or visual diagram that shows the calculated perimeter values of different shapes based on their side lengths. It helps students quickly compare and understand how perimeter changes with dimensions.
- Lists shapes (square, rectangle, triangle, etc.).
- Shows side measurements.
- Displays the calculated perimeter values.
2. What is the formula for perimeter?
The perimeter is calculated by adding the lengths of all the sides of a shape. Common formulas include:
- Square: P = 4 × side
- Rectangle: P = 2(l + w)
- Triangle: P = a + b + c
3. How do you calculate the perimeter of a rectangle using a chart?
To calculate the perimeter of a rectangle using a chart, apply the formula P = 2(l + w) to the listed length and width values. Steps:
- Find the rectangle's length (l) and width (w) in the chart.
- Add them together.
- Multiply the result by 2.
4. How do you find the perimeter of a square from a perimeter chart?
The perimeter of a square is found using the formula P = 4 × side length. From the chart:
- Locate the side length.
- Multiply it by 4.
5. What is the perimeter of a triangle?
The perimeter of a triangle is the sum of its three sides, given by P = a + b + c. For example:
- If sides are 4 cm, 5 cm, and 6 cm
- P = 4 + 5 + 6 = 15 cm
6. Why is a perimeter chart useful for students?
A perimeter chart is useful because it visually organizes side lengths and their corresponding perimeter calculations for easy comparison. It helps students:
- Understand perimeter formulas clearly.
- Identify patterns in measurements.
- Quickly check calculated answers.
7. What is the difference between perimeter and area?
The perimeter is the total distance around a shape, while the area is the space inside the shape. Key differences:
- Perimeter is measured in linear units (cm, m).
- Area is measured in square units (cm², m²).
- Perimeter adds side lengths; area uses multiplication formulas.
8. How do you create a perimeter chart?
To create a perimeter chart, list shapes and calculate their perimeter using the correct formulas. Steps:
- Choose the shapes (square, rectangle, triangle).
- Record given side lengths.
- Apply the appropriate perimeter formula.
- Enter the calculated results into a table.
9. Can two different shapes have the same perimeter?
Yes, two different shapes can have the same perimeter even if their areas are different. For example:
- Rectangle: 6 cm × 2 cm → P = 2(6 + 2) = 16 cm
- Square: side 4 cm → P = 4 × 4 = 16 cm
10. What are common mistakes when reading a perimeter chart?
Common mistakes when using a perimeter chart include misreading side lengths or applying the wrong formula. Students should avoid:
- Confusing perimeter with area.
- Forgetting to add all sides.
- Using incorrect units.
- Mixing up rectangle and square formulas.