


CBSE Important Questions for Class 6 Maths Symmetry - 2026-27
1. What is a line of symmetry?
Ans: A line of symmetry divides a shape into two identical, mirror-image halves.
2. How many lines of symmetry does a square have?
Ans: A square has 4 lines of symmetry.
3. What is mirror symmetry?
Ans: Mirror symmetry is when one side of a shape reflects exactly onto the other side.
4. Does a circle have symmetry?
Ans: Yes, a circle has infinite lines of symmetry.
5. Give an example of symmetry in nature.
Ans: A butterfly has symmetry, with each wing mirroring the other.
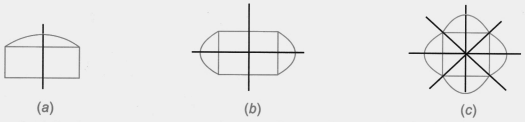
6. In the following figures, identify the figure that has:
(i) line of symmetry
(ii) rotational symmetry
(iii) both lines of symmetry and rotational symmetry
(iv) Neither line of symmetry nor rotational symmetry
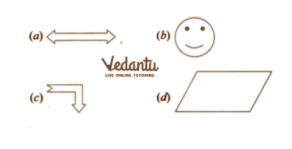
Ans:
(i) Figures (a) and (b) display line symmetry.
(ii) Figures (a) and (d) show rotational symmetry.
(iii) Figure (a) possesses both line symmetry and rotational symmetry.
(iv) Figure (c) lacks both line symmetry and rotational symmetry.
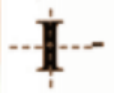
7. How many lines of symmetry do the following English alphabets have?
(i)

(ii)

Ans: The letters H and I in the English alphabet each have two lines of symmetry, as illustrated.
(i)

(ii)
8. How many lines of symmetry do the following letters of the English alphabet have?
(i)

(ii)

Ans: The letters F and J in the English alphabet have no lines of symmetry.
9. Write any five letters in the English alphabet such that they have one line of symmetry. Show the line of symmetry for each of them.
Ans:

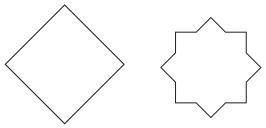
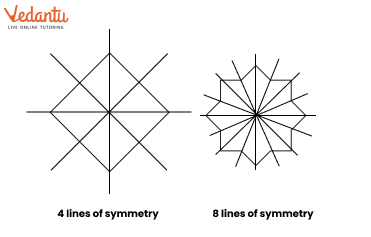
10. Find the lines of symmetry and rotational symmetry of the following figure.
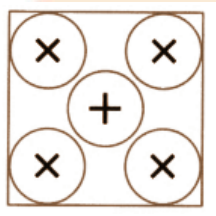
Ans: The figure has four lines of symmetry, as shown.
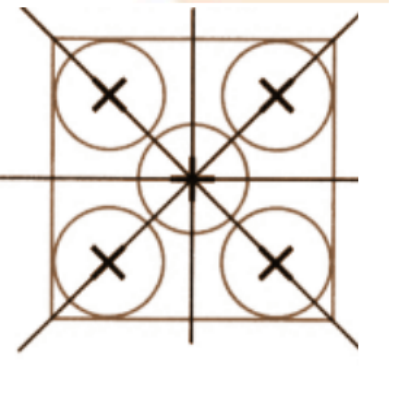
The rotational symmetry is as follows:
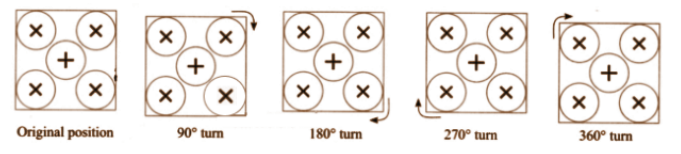
The given figure returns to its original shape when rotated by 90°, 180°, 270°, and 360°. Therefore, it has 4 angles of symmetry: 90°, 180°, 270°, and 360°.
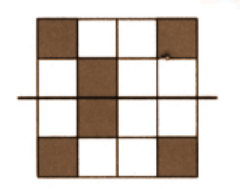
11. Minimum, how many unit squares will you colour so that the figure has:
(i) Only one line of symmetry?
(ii) two lines of symmetry?
(iii) four lines of symmetry?
(iv) Only a horizontal line of symmetry?
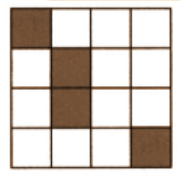
Ans:
(i) One unit square will be coloured to have only one line of symmetry.
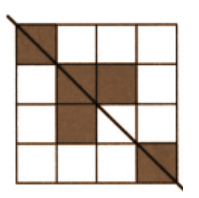
(ii) Two unit squares will be coloured to have two lines of symmetry.
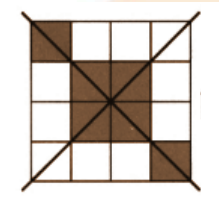
(iii) Four unit squares will be coloured to have four lines
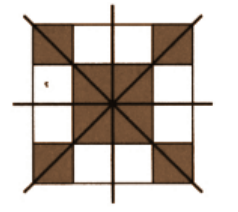
(iv) Two unit squares will be coloured to have only a horizontal line of symmetry.
12. Explain the process of identifying lines of symmetry in different geometric shapes. Provide examples of shapes with 1, 2, 4, and infinite lines of symmetry.
Ans: To identify lines of symmetry, examine if a shape can be divided into two identical halves. For example, a rectangle has 2 lines of symmetry, a square has 4, a circle has infinite lines of symmetry, and a triangle (depending on the type) may have 1 line of symmetry.
13. Describe the difference between line symmetry and rotational symmetry with examples.
Ans: Line symmetry divides a shape into mirror halves across a line, such as in a rectangle or butterfly. Rotational symmetry occurs when a shape looks the same after being rotated by a certain angle, like a square, which appears the same at 90°, 180°, and 270°.
14. How can symmetry be observed in nature? List five examples of natural objects or organisms that display symmetry and describe their type of symmetry.
Ans: Symmetry in nature includes butterflies with line symmetry, starfish with radial symmetry, leaves with line symmetry, snowflakes with rotational symmetry, and flowers (like daisies) with radial symmetry. This natural symmetry helps maintain balance and appeal in structures.
15. How would you use symmetry to design a simple pattern? Describe the steps and explain how symmetry enhances the visual appeal of the design.
Ans: To create a symmetrical pattern, start by drawing a base shape, such as a square. Divide it with lines of symmetry (horizontal, vertical, or diagonal) and replicate designs in each section to mirror across the lines. Symmetry provides balance and uniformity, making the pattern visually pleasing and harmonious.
Practise Extra Questions on Symmetry
1. How many lines of symmetry do these shapes have?
Ans:
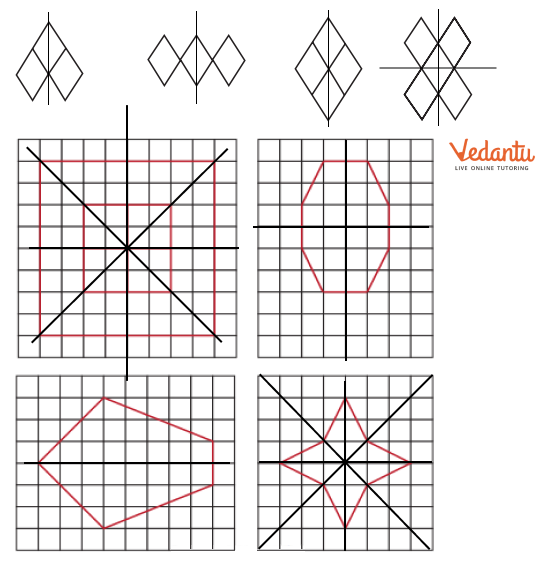
2. Trace each figure and draw the lines of symmetry, if any:
Ans:
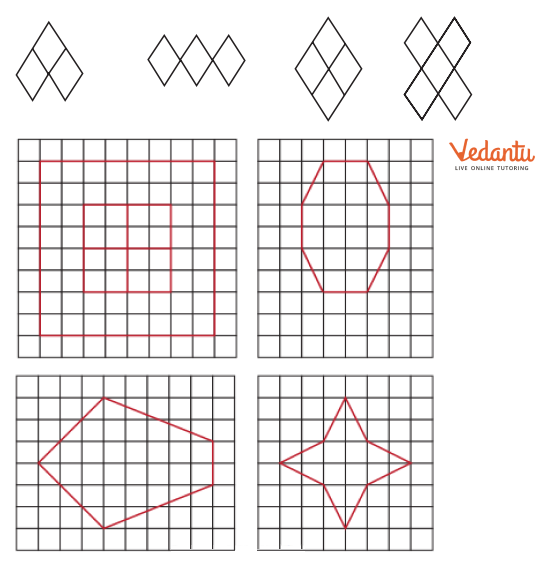
3. Draw the following. In each case, the figure should contain at least one curved boundary.
a. A figure with exactly one line of symmetry.
b. A figure with exactly two lines of symmetry.
c. A figure with exactly four lines of symmetry.
Ans:
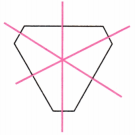
4. This is a picture of the new Parliament Building in Delhi.
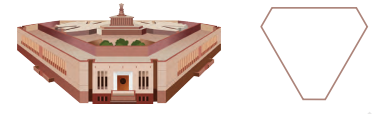
a. Does the outer boundary of the picture have reflection symmetry? If so, draw the lines of symmetries. How many are there?
Ans: The outer boundary exhibits rotational symmetry around its centre.
The smallest angle of rotation is calculated as 360° ÷ 3 = 120°.
Additional angles of rotation are 240° and 360°.
b. Does it have rotational symmetry around its centre? If so, find the angles of rotational symmetry.
Ans: The outer boundary displays reflection symmetry, featuring 3 lines of symmetry.
5. How many lines of symmetry and angles of symmetry does Ashoka Chakra have?

Ans: The Ashoka Chakra features 24 spokes that are evenly distributed. These 24 spokes form 12 pairs. A line drawn through each opposite pair represents a line of symmetry, resulting in a total of 12 lines of symmetry. The smallest angle of symmetry is calculated as 360° ÷ 12 = 30°. The other angles of symmetry are multiples of this angle up to 360°. These include 60°, 120°, 150°, and so on, totaling 12 angles.
This page offers CBSE Class 6 Maths Important Questions and extra questions for Chapter 9 Symmetry. At Vedantu, we create short answer questions after reviewing the previous test papers so students can easily rely on our guide.
This page also contains some extra questions to give students more practise to score well in upcoming exams.
Related Study Materials for Class 6 Maths Chapter 9 Symmetry
CBSE Class 6 Maths Chapter-wise Important Questions
Important Related Links for CBSE Class 6 Maths

FAQs on Important Questions For Class 6 Maths Chapter 9 Symmetry - 2026-27
1. What are the most frequently asked types of questions from CBSE Class 6 Maths Chapter 9, Symmetry, for the 2026-27 exams?
For the 2026-27 exams, students should focus on these important question types from Symmetry:
- Identifying lines of symmetry: Questions asking to find and draw all possible lines of symmetry for given shapes like triangles, squares, and alphabets.
- Completing symmetrical figures: You will be given half a figure along a line of symmetry and asked to draw the other half.
- Checking for symmetry: Determining if a given shape is symmetrical or not.
- Conceptual questions: Questions about shapes with a specific number of symmetry lines (e.g., a shape with exactly one line of symmetry).
2. How can I score full marks on questions asking to find lines of symmetry in geometrical figures?
To score full marks, ensure you identify all possible lines of symmetry. A good method is to imagine folding the shape along a line. If one half perfectly covers the other, that line is a line of symmetry. For regular polygons, the number of sides equals the number of lines of symmetry. For letters, carefully check for both horizontal and vertical symmetry.
3. Which capital letters of the English alphabet are important examples of symmetry for exam questions?
For exam purposes, it's important to know the symmetry of various letters. Key examples include:
- Vertical line of symmetry: A, H, I, M, O, T, U, V, W, X, Y
- Horizontal line of symmetry: B, C, D, E, H, I, K, O, X
- Both horizontal and vertical symmetry: H, I, O, X
- No lines of symmetry: F, G, J, L, N, P, Q, R, S, Z
4. Why does a circle have infinite lines of symmetry? Is this an important concept?
Yes, this is a very important concept. A circle has infinite lines of symmetry because any line that passes through its centre will divide the circle into two identical semicircles. Since you can draw an infinite number of such lines through the centre, a circle is considered to have an infinite number of symmetry lines. This is a common question to test conceptual understanding.
5. What is a common mistake students make in Symmetry questions, and how can I avoid it?
A common mistake is confusing the diagonals with lines of symmetry in all quadrilaterals. While diagonals are lines of symmetry for a square and a rhombus, they are not lines of symmetry for a rectangle or a general parallelogram. Always use the 'folding test' mentally to confirm if a line, including a diagonal, truly creates two mirror-image halves.
6. How is the concept of reflection used in Symmetry?
Reflection and symmetry are directly related. A line of symmetry can be thought of as a 'mirror line'. Every point on one side of the symmetrical figure has a corresponding point on the other side at the same perpendicular distance from the line. The entire shape is a combination of one half and its reflection across the line of symmetry.
7. Can a triangle have exactly two lines of symmetry? Why is this a tricky question?
No, a triangle cannot have exactly two lines of symmetry. This is a higher-order thinking (HOTS) question. Here's why:
- A triangle with one line of symmetry is an isosceles triangle.
- A triangle with three lines of symmetry is an equilateral triangle.
- If a triangle were to have two lines of symmetry, it would imply that two pairs of sides and angles are equal, which forces the third pair to also be equal, making it an equilateral triangle. Therefore, it would automatically have a third line of symmetry.
8. What is the difference between the lines of symmetry in a rectangle and a square?
This is a key comparison question. A rectangle has two lines of symmetry which are the lines joining the mid-points of its opposite sides. A square, being a special rectangle, has these two lines plus two more lines of symmetry along its diagonals, making a total of four.
9. From an exam perspective, what are some real-world examples of symmetry that I should know?
Knowing real-world examples helps in application-based questions. For the exam, remember examples from:
- Nature: Butterflies, flowers, leaves, snowflakes.
- Architecture: Building facades, monuments like the Taj Mahal.
- Human-made objects: Car wheels, kites, designs, and patterns.