


Solved NCERT Questions For Class 6 Maths Chapter 9 In Hindi - Free PDF
प्रश्नावली 9.1
1. गणित के एक टेस्ट में 40 विद्यार्थियों द्वारा निम्नलिखित अंक प्राप्त किए गए। इन अंकों को मिलान चिन्हों का प्रयोग करके, एक सारणी के रूप में व्यवस्थित कीजिए।
$\begin{array}{*{35}{l}} 8 & 1 & 3 & 7 & 6 & 5 & 5 & 4 & 4 & 3 \\ 4 & 9 & 5 & 3 & 7 & 1 & 6 & 5 & 2 & 7 \\ 7 & 3 & 8 & 4 & 2 & 8 & 9 & 5 & 8 & 6 \\ 7 & 4 & 5 & 6 & 9 & 6 & 4 & 4 & 6 & 6 \\ \end{array}\begin{array}{*{35}{l}} ~ \\ ~ \\ \end{array}$
उत्तर:
ज्ञात कीजिए कि कितने विद्यार्थियों ने $\mathbf{7}$ या उससे अधिक अंक प्राप्त किए।
उत्तर: उपरोक्त सारणी से स्पष्ट है कि $12$ विद्यार्थियो ने $\mathbf{7}$ या उससे अधिक अंक प्राप्त किए।
कितने विद्यार्थियों ने $\mathbf{7}$ या उससे कम अंक प्राप्त किए?
उत्तर: उपरोक्त सारणी से स्पष्ट है कि $8$ विद्यार्थियो ने 4 से कम अंक प्राप्त किए।
2. कक्षा $\mathbf{VI}$ के $\mathbf{30}$ विद्यार्थियों की मिठाइयों की पसंद निम्नलिखित है:
लड्डू, बरफी, लड्डू, जलेबी, लड्डू, रसगुल्ला
जलेबी, लड्डू, बरफी, रसगुल्ला, लड्डू, जलेबी
जलेबी, रसगुल्ला, लड्डू, रसगुल्ला, जलेबी, लड्डू
रसगुल्ला, लड्डू, बरफी, रसगुल्ला, रसगुल्ला, लड्डू
जलेबी, रसगुल्ला, लड्डू, रसगुल्ला, जलेबी, लड्डू।
मिठाइयों के इन नामों को मिलान चिन्हों का प्रयोग करते हुए एक सारणी में व्यवस्थित कीजिए।
उत्तर:
कौन सी मिठाई विद्यार्थियों द्वारा अधिक पसंद की गई?
उत्तर: लड्डू, विद्यार्थिओं ($11$ विद्यार्थी ) द्वारा सबसे अधिक पसंद किया जाता है।
3. केथरिन ने एक पासा(dice) लिया और उसको $\mathbf{40}$ बार उछालने पर प्राप्त संख्या को लिख लिया। उसने इस कार्य को $\mathbf{40}$ बार किया और प्रत्येक बार प्राप्त संख्याओं को निम्न प्रकार लिखा।
एक सारणी बनाइए और आँकड़ों को मिलान चिन्हों का प्रयोग करके लिखिए।
उत्तर:
अब, ज्ञात कीजिए:
न्यूनतम बार आने वाली संख्या?
उत्तर: $4$
अधिकतम बार आने वाली संख्या?
उत्तर: $5$
समान बार आने वाली संख्याएँ।
उत्तर: $1$ और $6$
4. निम्नलिखित चित्रालेख पाँच गाँवों में ट्रैक्टरों की संख्या दर्शाता है:
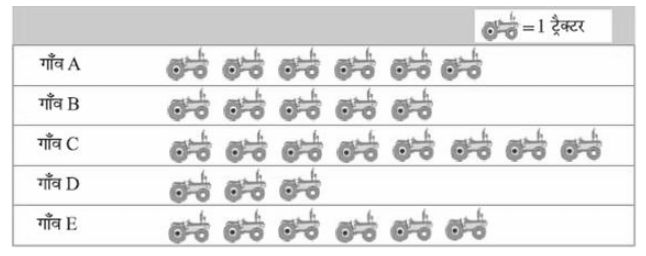
चित्रालेख को देखिए और निम्न प्रश्नों के उत्तर दीजिए:
किस गाँव में ट्रैक्टरों की संख्या न्यूनतम है?
उत्तर: D
किस गाँव में ट्रैक्टरों की संख्या अधिकतम है?
उत्तर: C
गाँव C में गाँव B से कितने ट्रैक्टर अधिक हैं?
उत्तर: 3
पाँचों गाँवों में कुल मिलाकर कितने ट्रैक्टर हैं?
उत्तर: 28
5. एक सह-शिक्षा माध्यमिक विद्यालय की प्रत्येक कक्षा में लड़कियों की संख्या निम्न चित्रालेख द्वारा प्रदर्शित है:
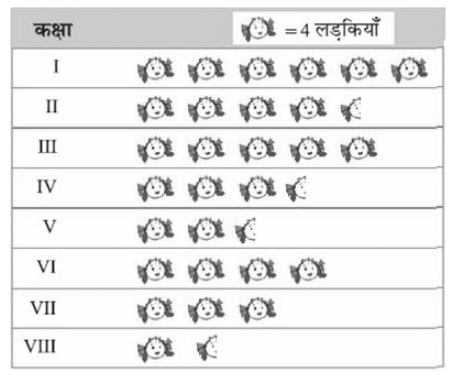
इस चित्रालेख को देखिए और निम्न प्रश्नों के उत्तर दीजिए:
किस कक्षा में लड़कियों की संख्या न्यूनतम है?
उत्तर: कक्षा $VIII$
क्या कक्षा $VII$ में लड़कियों की संख्या कक्षा V की लड़कियों की संख्या से कम है।
उत्तर: नहीं
कक्षा $VII$ में कितनी लड़कियाँ हैं?
उत्तर: $3\times 4=12$ लड़कियाँ
6. किसी सप्ताह के विभिन्न दिनों में बिजली के बल्बों की बिक्री नीचे दर्शाई गई है:
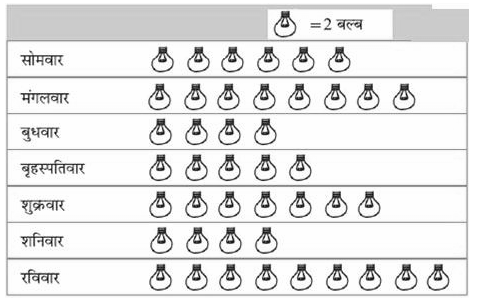
चित्रालेख को देखिए और निम्न प्रश्नों के उत्तर दीजिए:
शुक्रवार को कितने बल्ब बेचे गए?
उत्तर: 14
किस दिन बेचे गए बल्बों की संख्या अधिकतम थी?
उत्तर: रविवार
किस दिन बेचे गए बल्बों की संख्या समान थी?
उत्तर: बुधवार और शनिवार
किस दिन बेचे गए बल्बों की संख्या न्यूनतम थी?
उत्तर: बुधवार और शनिवार
यदि एक बड़े डब्बे में $\mathbf{9}$ बल्ब आ सकते हैं, तो इस सप्ताह कितने डब्बों की आवश्यकता पड़ी?
उत्तर: 10
7. एक विशेष मौसम में, एक गाँव में 6 फल विक्रेताओं द्वारा बेची गई फलों की टोकरियों की संख्या निम्न चित्रलेखा द्वारा प्रदर्शित है:
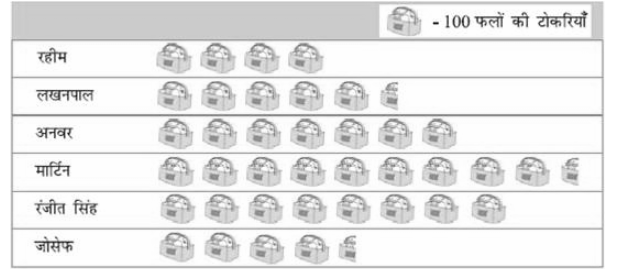
इस चित्रालेख को देखिए और निम्न प्रश्नों के उत्तर दीजिए:
किस फल विक्रेता ने अधिकतम फलों की टोकरियाँ बेची?
उत्तर: मार्टिन ने
अनवर ने फलों की कितनी टोकरियाँ बेची?
उत्तर: $7\times 100=700$
वे विक्रेता जिन्होंने 600 या उससे अधिक टोकरियाँ बेचीं, अगले मौसम में गोदाम खरीदने की योजना बना रहे हैं। क्या आप उनके नाम बता सकते हैं?
उत्तर: अनवर, मार्टिन और रंजीत सिंह
प्रश्नावली 9.2
1. पाँच गाँवों में पशुओं की कुल संख्या इस प्रकार है:
संकेत $\otimes $ का प्रयोग करके जो $\mathbf{10}$ पशुओं को निरूपित करता है, इन पशुओं का एक चित्रालेख बनाइए और निम्न प्रश्नों के उत्तर दीजिए:
गाँव $E$ के पशुओं को कितने संकेत निरूपित करते हैं?
किस गाँव में पशुओं की संख्या अधिकतम है?
किस गाँव में अधिक पशु हैं : गाँव $A$ या गाँव $C$ में?
उत्तर: चित्रालेख
गाँव $E$ के पशुओं को $6$ संकेत निरूपित करते हैं ।
$B$ गाँव में पशुओं की संख्या अधिकतम है ।
$C$ गाँव में अधिक पशु हैं।
2: विभिन्न वर्षों में एक स्कूल के विद्यार्थियों की कुल संख्या निम्न सारणी द्वारा प्रदर्शित है:
A. एक संकेत ☺ का प्रयोग करके, जो $100$ विद्यार्थियों को निरूपित करता है और ♡, 5 और *, 1 विद्यार्थी को निरूपित करता है, एक चित्रालेख बनाइए और निम्न प्रश्नों के उत्तर दीजिए:
(a) वर्ष-2002 में कुल विद्यार्थियों की संख्या को कितने संकेत निरूपित कर रहे हैं?
(b) वर्ष-1998 में कुल विद्यार्थियों की संख्या को कितने संकेत निरूपित कर रहे हैं?
उत्तर: चित्रालेख
वर्ष-$2002$ में कुल विद्यार्थियों की संख्या को $6$ संकेत निरूपित कर रहे हैं।
वर्ष-$1998$ में कुल विद्यार्थियों की संख्या को $5$ पूर्ण और $7$ अपूर्ण संकेत निरूपित कर रहे हैं।
B.कोई और संकेत लेकर जो $\mathbf{50}$विद्यार्थियों को निरूपित करता है, एक अन्य चित्रलेखा बनाइए। कौन-सा चित्रालेख अधिक सूचनाप्रद है?
उत्तर: चित्रलेखा
प्रश्नावली 9.3
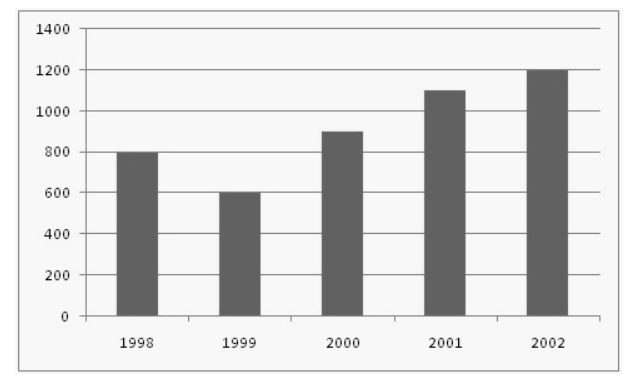
1. नीचे दिया हुआ दंड आलेख वर्ष $\mathbf{1998}-\mathbf{2002}$ में सरकार द्वारा खरीदे गए गेहूँ की मात्रा दर्शाता है:
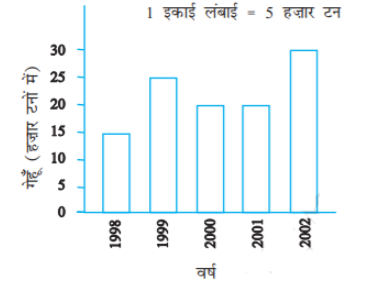
इस दंड आलेख को पढ़िए और अपने प्रेक्षणों को लिखिए।
किस वर्ष में गेहूँ का अधिकतम उत्पादन हुआ?
उत्तर: $2002$
किस वर्ष में गेहूँ का न्यूनतम उत्पादन हुआ?
उत्तर: $1998$
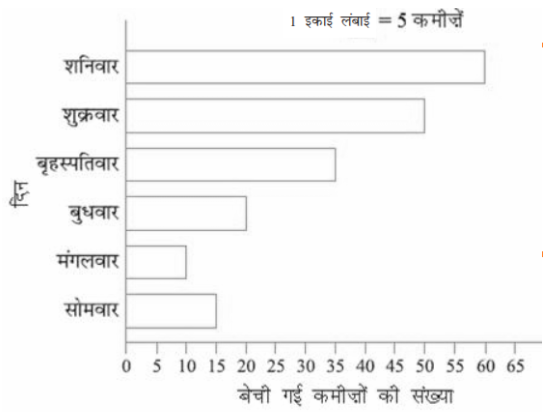
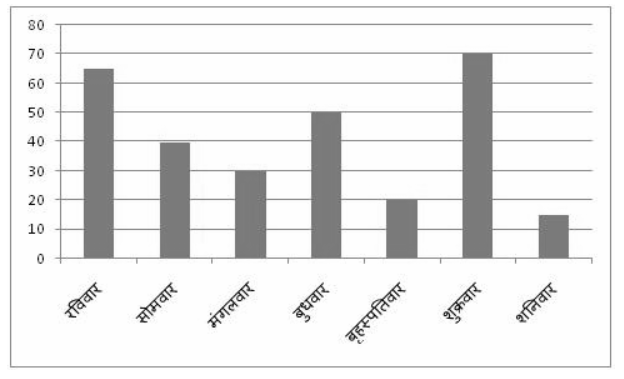
2. इस दंड आलेख को देखिए जो एक रेडिमेड कपड़ों की दुकान में सोमवार से शनिवार तक हुई कमीज़ों की बिक्री को दर्शाता है।
अब निम्नलिखित प्रश्नों के उत्तर दीजिए:
उपरोक्त दंड आलेख में क्या सूचना दर्शाई गई है?
उत्तर: एक रेडिमेड कपड़े की दुकान में सोमवार से शनिवार तक हुई कमीजों की बिक्री
कमीज़ों की संख्या को निरूपित करने के लिए क्षैतिज रेखा पर क्या पैमाना लिया गया है?
उत्तर: एक बॉक्स $=$ पाँच कमीज
किस दिन अधिकतम कमीज़े बेची गईं और कितनी संख्या में कमीजें बेची गईं, लिखें?
उत्तर: शनिवार को ( $=60$ कमीज़े बेची गईं
किस दिन न्यूनतम संख्या में कमीज़े बेची गईं?
उत्तर: मंगलवार
बृहस्पतिवार को कितनी कमीजें बेची गईं?
उत्तर: $35$
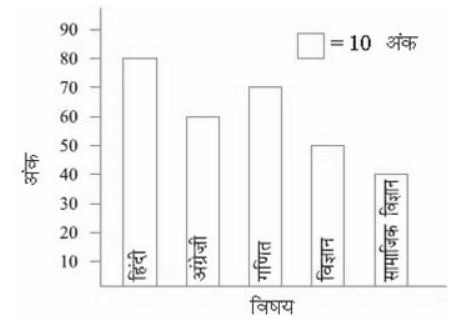
3. इस दंड आलेख को देखिए जो अज़ीज द्वारा अर्धवार्षिक परीक्षा में विभिन्न विषयों में प्राप्त किए गए अंकों को प्रदर्शित करता है:
निम्नलिखित प्रश्नों के उत्तर दीजिए:
यह दंड आलेख क्या सूचना प्रदर्शित करता है?
उत्तर: अजीज द्वारा अर्धवार्षिक परीक्षा में विभिन्न विषयों में प्राप्तांक प्रदर्शित करता है
किस विषय में अज़ीज ने अधिकतम अंक प्राप्त किए?
उत्तर: हिंदी
किस विषय में उसने ने न्यूनतम अंक प्राप्त किए?
उत्तर: सामाजिक विज्ञान
विषयों के नाम लिखिए और उनमें से प्रत्येक में प्राप्त किए गए अंक भी लिखिए।
उत्तर:
प्रश्नावली 9.4
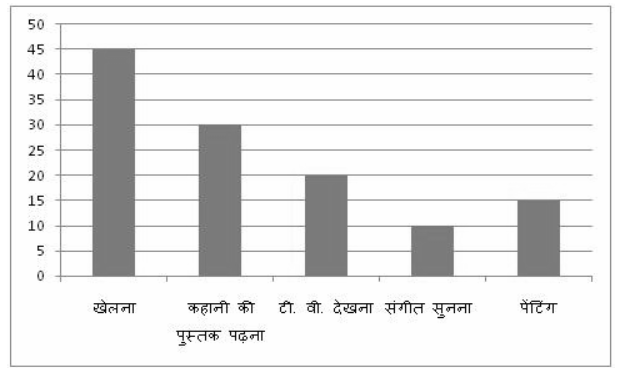
1. एक स्कूल के $\mathbf{120}$ विद्यार्थियों का इस आशय से सर्वेक्षण किया गया कि वे अपने खाली समय में किस क्रियाकलाप को पसंद करते है। निम्न आँकड़े प्राप्त हुए:
$\mathbf{1}$ इकाई लंबाई $=\mathbf{5}$ विद्यार्थी का पैमाना लेकर, एक दंड आलेख बनाइए। खेलने के अतिरिक्त कौन-सा क्रियाकलाप अधिकांश विद्यार्थियों द्वारा पसंद किया जाता है।
उत्तर: $\mathbf{1}$ इकाई लंबाई $=\mathbf{5}$ विद्यार्थी का पैमाना लेकर, एक दंड आलेख बनाया। खेलने के अतिरिक्त कहानीकी पुस्तक पढ़ना अधिकांश विद्यार्थियों द्वारा पसंद किया जाता है।
2. छ: क्रमागत दिनों में किसी दुकानदार द्वारा बेची गई गणित के पुस्तकों की संख्या नीचे दी गई है:
अपनी पसंद का पैमाना चुनते हुए, उपरोक्त सूचना के लिए एक दंड आलेख खींचिए।
उत्तर:
3. वर्ष $\mathbf{1998}$ से $\mathbf{2002}$ के बीच एक फैक्टरी द्वारा निर्मित साइकिलों की संख्या निम्नलिखित सारणी द्वारा दर्शाई गई है:
इन आँकड़ों को एक दंड आलेख द्वारा प्रदर्शित कीजिए। अपनी पसंद का पैमाना चुनिए।
उत्तर:
किस वर्ष में अधिकतम संख्या में साईकिलें निर्मित की गईं?
उत्तर: वर्ष 2002 में
किस वर्ष में न्यूनतम संख्या में साईकिलें निर्मित की गईं?
उत्तर: वर्ष 1999 में
4. किसी शहर के व्यक्तियों की संख्या विभिन्न आयु समूहों के अनुसार नीचे सारणी में दी हुई है:
इन आँकड़ों को एक दंड आलेख द्वारा निरूपित कीजिए। ($1$ इकाई लंबाई $=$ $1$ हज़ार लीजिए)
उत्तर: दंड आलेख
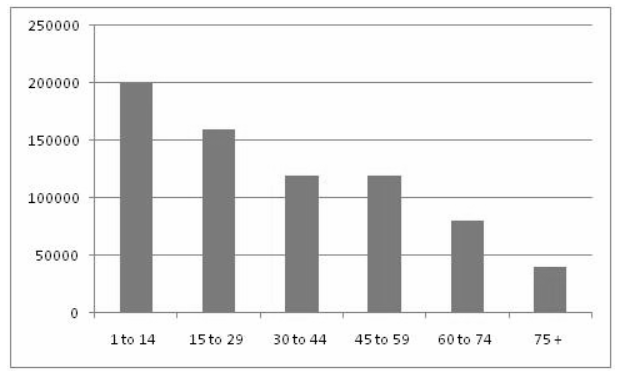
निम्नलिखित प्रश्नों के उत्तर दीजिए:
किन दो आयु समूहों में जनसंख्या बराबर है?
उत्तर: $30$ से $44$ और $45$ से $59$ में जनसंख्या बराबर है।
$\mathbf{60}$ वर्ष और उससे अधिक आयु के सभी व्यक्ति वरिष्ठ नागरिक कहलाते हैं। इस शहर में कितने वरिष्ठ नागरिक हैं?
उत्तर: वरिष्ठ नागरिकों की संख्या $=(80,000+40,000)=1,20,000$
NCERT Solutions for Class 6 Maths Chapter 9 Data Handling in Hindi
Chapter-wise NCERT Solutions are provided everywhere on the internet with an aim to help the students to gain a comprehensive understanding. Class 6 Maths Chapter 9 solution Hindi mediums are created by our in-house experts keeping the understanding ability of all types of candidates in mind. NCERT textbooks and solutions are built to give a strong foundation to every concept. These NCERT Solutions for Class 6 Maths Chapter 9 in Hindi ensure a smooth understanding of all the concepts including the advanced concepts covered in the textbook.
NCERT Solutions for Class 6 Maths Chapter 9 in Hindi medium PDF download are easily available on our official website (vedantu.com). Upon visiting the website, you have to register on the website with your phone number and email address. Then you will be able to download all the study materials of your preference in a click. You can also download the Class 6 Maths Data Handling solution Hindi medium from Vedantu app as well by following the similar procedures, but you have to download the app from Google play store before doing that.
NCERT Solutions in Hindi medium have been created keeping those students in mind who are studying in a Hindi medium school. These NCERT Solutions for Class 6 Maths Data Handling in Hindi medium pdf download have innumerable benefits as these are created in simple and easy-to-understand language. The best feature of these solutions is a free download option. Students of Class 6 can download these solutions at any time as per their convenience for self-study purpose.
These solutions are nothing but a compilation of all the answers to the questions of the textbook exercises. The answers/ solutions are given in a stepwise format and very well researched by the subject matter experts who have relevant experience in this field. Relevant diagrams, graphs, illustrations are provided along with the answers wherever required. In nutshell, NCERT Solutions for Class 6 Maths in Hindi come really handy in exam preparation and quick revision as well prior to the final examinations.

FAQs on NCERT Solutions For Class 6 Maths In Hindi Chapter 9 Data Handling - 2025-26
1. Does Vedantu provide detailed graphic representations for the solutions of Chapter 9?
Data Handling is a chapter that deals with many graphical representations of the data. The questions in the NCERT Textbook ask the students to draw tables, pictographs, and interpret the data as well. Thus, it is important that the solutions provided for this chapter illustrate the answers graphically in step-by-step detail. Hence, detailed graphical representations are provided by Vedantu for NCERT Class 6 Chapter 9 Maths wherever required for a better understanding of the students. Moreover these solutions are available free of cost.
2. Does Vedantu offer other resources in addition to the NCERT Solutions?
The biggest advantage of using Vedantu is that it not only provides the best NCERT Solutions but also takes an extra step with explaining the difficult concepts, objectives of the chapter, important terms, etc. In addition to this Vedantu also offers free masterClasses and conceptual videos to aid in the learning experience. Students can even enroll in private Classes for better guidance from expert teachers. Vedantu, therefore, offers a complete package.
3. How to organize data discussed in Chapter 9 of NCERT Solutions for Class 6 Maths?
NCERT Solutions for Class 6 Maths Chapter 9 discusses various ways of documenting certain recorded data. Students are taught to organize data in the form of tables, using tally marks, and pictographs. Students are also taught ways to interpret this data.
The chapter provides several practice questions for students to record data and interpret it. Students can refer to Vedantu's NCERT solutions for this chapter NCERT Solutions for Class 6 Maths Chapter 9 for a detailed representation of how to organize the data asked.
4. How many exercises are present in Chapter 9 of NCERT Solutions for Class 6 Maths?
Vedantu provides solutions to each and every question asked in the NCERT Textbook. These answers are crafted in complete detail and are easy to follow. Chapter 9 has a total of 4 exercises in the NCERT textbook. Vedantu provides solutions for all of these exercises. The solutions are also provided in the Hindi language catering especially to Vedantu's Hindi medium students. Students can easily look up these solutions NCERT Solutions for Class 6 Maths Chapter 9.
5. Why is it important to learn Data Handling? Does it have any application in real life?
Data Handling has many uses in different fields in the real world. For instance, it may be used in libraries to keep records of the books, keeping patient records, weather records, scoreboards, etc. Pictographs taught in the chapter also come in handy when large quantities have to be represented in a simple manner graphically. Familiarizing oneself with different data handling techniques may help students in their future career choices.