


What Is a Frequency Table and How to Create One with Examples
What is a Frequency?
The number of times a particular data value occurs in a given data set is referred to as its frequency. Let us understand the concept of the frequency with a simple example of grades obtained by the students of your group in the Maths project. Let’s say there are 10 students in your project group, and three of you obtained grade A in the project. Four of the students in your group get a B+, two students score a C, and one student scores D. Now, let us note down the grades obtained by each of you in a series.
A, A, A, B, B, B, B, C, C, D
Count the number of times each grade occurs in the above series. Yes, ‘A’ occurs thrice, ‘B+’ occurs four times, ‘C’ occurs twice, and ‘D’ occurs once. Now, according to the definition of frequency, we can note the frequency of each grade as follows:
Frequency of A = 3
Frequency of B = 4
Frequency of C = 2
Frequency of D = 1
Let us now learn about the frequency table.
What is a Frequency Table?
A frequency table consists of the lists of items in a given data set and the number of times each item occurs in the data set.
Let us list the grades obtained by the students in the above example, in a frequency table.
To be more precise, here, in the above table, we have arranged the data (or grades) alongside their corresponding frequencies. The data values are listed in ascending order in frequency tables.
What are Tally Marks?
Let us now understand tally marks in a frequency table. Tally marks make an easy way to note and record the frequencies of the values in a given data set. The frequencies 1 to 4 are represented by short straight lines, quite like the Roman 1, in tally. The below-given picture shows the tally marks for frequencies from 1 to 10.
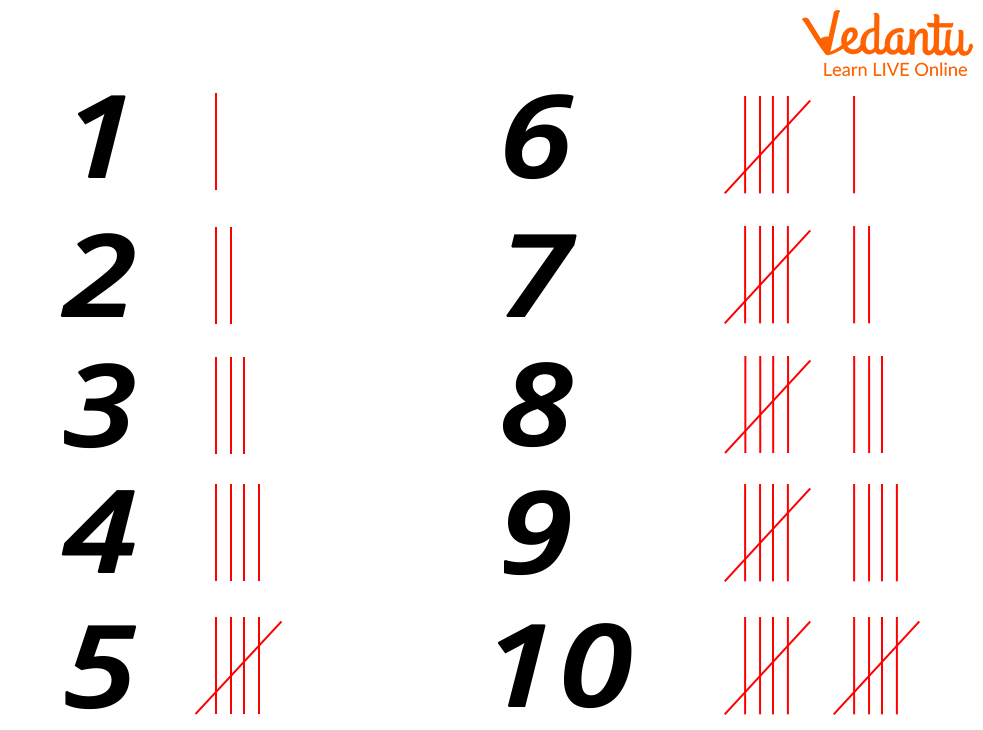
Tally marks
For frequency 1, the tally marks will be ‘I’; for frequencies 2, 3, and 4, the tally marks will be represented by repeating ‘I’ as many times as the frequency. However, the tally marks for frequency 5 is represented by oblique strike-through on the tally marks for 4.
Again, we represent frequency 6 as ‘I’ after the tally for 5. The same process is repeated to represent the rest of the frequencies in tally marks.
How to Create a Frequency Table?
Step 1: Make a table with three columns.
Step 2: List the data in ascending order in the first column.
Step 3: The second column is for tally marks. Count the number of times each data value occurs in the given data set and write the tally marks accordingly.
Step 4: The third column is for frequencies. Count the tally marks in the second column for each data value and write the corresponding frequency in the third column.
Frequency Table Example
Solved Examples
Let us now go through a few solved examples on frequency tables.
Example 1:
The marks obtained in an English test by a class of 20 students are given below.
(Full marks: 30)
25, 23, 28, 21, 24, 23, 23, 25, 22, 21, 28, 21, 23, 25, 28, 21, 25, 24, 22, 22
Represent the above-given marks in a frequency table with tally marks.
Solution:
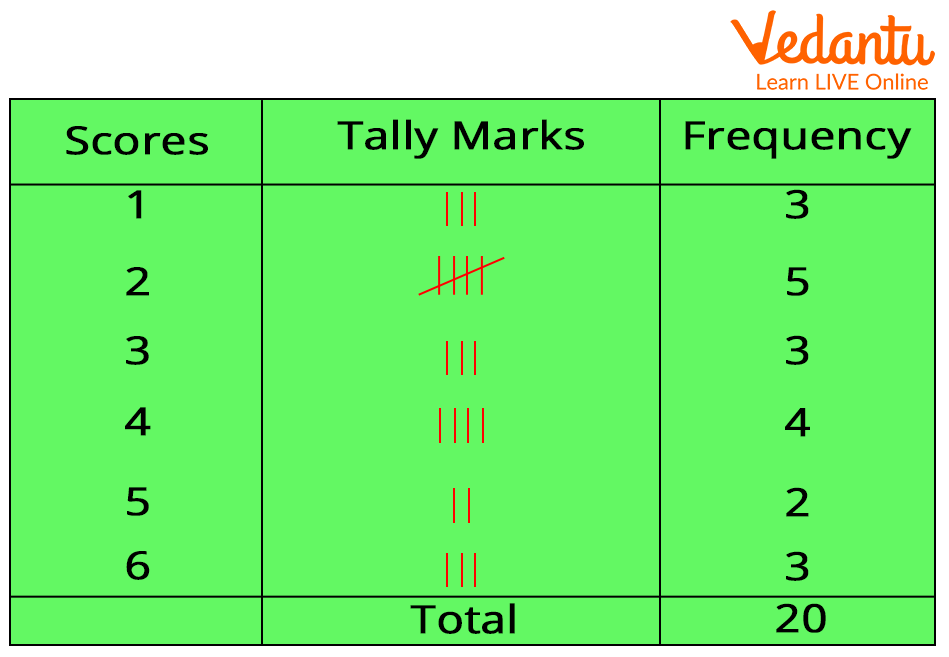
Example 2:
Mary and Alice had a basketball challenge. The basket was high enough for them and each of them was given 3 chances to score. Mary’s scores were 0, 0, and 0. Alice’s scores were 1,1, and 0. Make a frequency table for the scores of Mary and Alice in the match.
What is Class Interval?
When the data set is spread out over a long range of values, the frequency table becomes clumsy if we make a separate row for each data. So, the data is classified into equal groups or class intervals for convenience. At most, a neat frequency table can have 5 to 10 rows, and each class interval should begin with a multiple of the group size.
For example, if the chosen group size is 10, the groups should ideally begin with 10, 20, 30, 40, 50, etc. Each group is referred to as a class interval in the frequency table.
The frequency of a class interval or group is determined by the number of data values occurring in the data set from the class interval.
Solved Example
Make a frequency distribution table for the following data:
11, 22, 4, 9, 0, 23, 14, 17, 7, 3, 28, 13, 21, 29, 7, 21, 4, 30, 17, 26, 9
Solution:
Let us first understand the range of the given data set, 0 to 30.
To have 5 to 10 rows in the frequency table, we can choose a class interval of 5.
Frequency tables have applications in various fields. To strengthen the understanding of frequency and frequency tables, kids may try to count and group their toys or stationery, like pens or colour pencils, and note the numbers in a frequency table. They may also note down the scores obtained by their friends in a particular test and arrange them in a frequency distribution table. The more they apply the concept of frequency tables in their day-to-day life, the more their analytical skills will develop. Therefore, practising frequency table worksheets will help kids organise and analyse any kind of data in the long run.
FAQs on Understanding Frequency Tables in Statistics
1. What is a frequency table in maths?
A frequency table is a table that shows how often each value or group of values occurs in a dataset. It organizes raw data into categories and lists the frequency (number of times) each value appears. For example, if the numbers 2, 3, 3, 5 appear in a dataset, the frequency table shows 2 → 1, 3 → 2, 5 → 1. Frequency tables are commonly used in statistics to summarize and analyze data clearly.
2. How do you create a frequency table step by step?
To create a frequency table, list each value (or class interval) and count how many times it appears in the data. Follow these steps:
- Write down all the data values.
- Identify distinct values or form class intervals (for grouped data).
- Use tally marks to count occurrences.
- Record the total count as the frequency.
3. What is the difference between grouped and ungrouped frequency tables?
An ungrouped frequency table lists individual data values, while a grouped frequency table organizes data into class intervals. Ungrouped tables are used for small datasets with distinct values. Grouped tables are used when there are many values, for example:
- Ungrouped: 5 → 2 times, 6 → 3 times.
- Grouped: 0–10 → 4, 11–20 → 6.
4. What is a cumulative frequency table?
A cumulative frequency table shows the running total of frequencies up to each class or value. It is calculated by adding each frequency to the sum of the previous ones. For example, if frequencies are 3, 5, and 2, the cumulative frequencies are 3, 8, and 10. Cumulative frequency is useful for finding medians and drawing ogives in statistics.
5. How do you find the mean from a frequency table?
To find the mean from a frequency table, use the formula Mean = (Σfx) / (Σf). Follow these steps:
- Multiply each value (x) by its frequency (f).
- Add all the products to get Σfx.
- Add all frequencies to get Σf.
- Divide Σfx by Σf.
6. How do you calculate relative frequency?
The relative frequency is found by dividing the frequency of a value by the total number of observations. The formula is Relative Frequency = f / N, where N is the total frequency. For example, if a value appears 4 times out of 20 observations, the relative frequency is 4/20 = 0.2 (or 20%). Relative frequency helps compare proportions in data analysis.
7. What is the class interval in a frequency table?
A class interval is a range of values used to group data in a grouped frequency table. It is written as lower limit–upper limit, such as 10–20. The width of a class interval is calculated as Upper Limit − Lower Limit. Class intervals make it easier to summarize continuous or large datasets.
8. Why are frequency tables important in statistics?
Frequency tables are important because they organize raw data into a clear and structured format for analysis. They help to:
- Summarize large datasets.
- Identify patterns and trends.
- Calculate mean, median, and mode.
- Create graphs like histograms and bar charts.
9. Can you give an example of a frequency table?
A simple example of a frequency table is shown using test scores: if scores are 5, 6, 5, 7, 6, 5, the table becomes:
- 5 → 3
- 6 → 2
- 7 → 1
10. What are common mistakes when making a frequency table?
Common mistakes when creating a frequency table include incorrect counting and overlapping class intervals. Avoid these errors:
- Miscounting frequencies.
- Using overlapping intervals like 0–10 and 10–20.
- Leaving gaps between class intervals.
- Forgetting to check that total frequency equals total data values.