


Linear Regression Formula Derivation Steps and Solved Problems
Linear regression is one of the most fundamental and widely used techniques in statistics and machine learning. It serves as the foundation for many complex algorithms and provides valuable insights into relationships between variables. This guide covers everything you need to know about linear regression, including its formula, examples, assumptions, types, and more.
What is Linear Regression?
Linear regression is used to predict the relationship between two variables by applying a linear equation to observed data. There are two types of variable, one variable is called an independent variable, and the other is a dependent variable. Linear regression is commonly used for predictive analysis. The main idea of regression is to examine two things. First, does a set of predictor variables do a good job in predicting an outcome (dependent) variable? The second thing is which variables are significant predictors of the outcome variable?
Linear Regression Example
Example 1: Linear regression can predict house prices based on size.
For example, if the formula is:
Price = 50,000 + 100 × Size (sq. ft),
a 2,000 sq. ft. house would cost:
Price = 50,000 + 100 × 2,000 = 250,000.
It helps find relationships and make predictions.
Example 2: Linear regression can predict sales based on advertising spend. For example, if the formula is:
Sales = 5,000 + 20 × Ad Spend (in $1,000s),
and a company spends $50,000 on ads:
Sales = 5,000 + 20 × 50 = 105,000.
It shows how advertising impacts sales.
Linear Regression Equation
The measure of the relationship between two variables is shown by the correlation coefficient. The range of the coefficient lies between -1 to +1. This coefficient shows the strength of the association of the observed data between two variables.
Linear Regression Equation is given below:
Y=a+bX
where X is the independent variable and it is plotted along the x-axis
Y is the dependent variable and it is plotted along the y-axis
Here, the slope of the line is b, and a is the intercept (the value of y when x = 0).
Linear Regression Formula
As we know, linear regression shows the linear relationship between two variables. The equation of linear regression is similar to that of the slope formula. We have learned this formula before in earlier classes such as a linear equation in two variables. Linear Regression Formula is given by the equation
Y= a + bX
We will find the value of a and b by using the below formula
a= \[\dfrac{\left ( \sum_{Y}^{} \right )\left ( \sum_{X^{2}}^{} \right )-\left ( \sum_{X}^{} \right )\left ( \sum_{XY}^{} \right )}{n\left ( \sum_{x^{2}}^{} \right )-\left ( \sum_{x}^{} \right )^{2}}\]
b= \[\dfrac{n\left ( \sum_{XY}^{} \right )-\left ( \sum_{X}^{} \right )\left ( \sum_{Y}^{} \right )}{n\left ( \sum_{x^{2}}^{} \right )-\left ( \sum_{x}^{} \right )^{2}}\]
How Does Linear Regression Work?
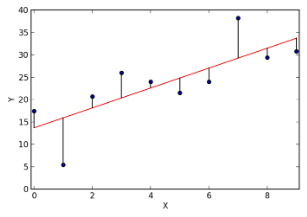
Linear regression works by modelling the relationship between two variables, x (independent variable) and y (dependent variable), using a straight line. The independent variable, x, is represented on the horizontal axis, while the dependent variable, y, is plotted on the vertical axis. The goal is to find a line that best fits the data points and explains the relationship between the variables.
Steps in Linear Regression
Using the simplest form of the equation for a straight line,$y = c \cdot x + m$, where ccc is the slope and mmm is the y-intercept, linear regression follows these steps:
Plot the Data Points: Start by plotting the given data points, such as (1,5), (2,8), and (3,11).
Adjust the Line: Draw a straight line and iteratively adjust its direction to minimise the distance (error) between the line and the data points.
Determine the Equation: Once the line fits the data, identify the equation of the line. For the given dataset, the equation becomes $y = 3 \cdot x + 2$.
Make Predictions: Use the equation to predict values. For example, when x=4, substitute it into the equation to find $y = 3 \cdot 4 + 2 = 14$.
This process enables linear regression to identify trends and make predictions based on existing data.
Properties of Linear Regression
For the regression line where the regression parameters b0 and b1are defined, the following properties are applicable:
The regression line reduces the sum of squared differences between observed values and predicted values.
The regression line passes through the mean of X and Y variable values.
The regression constant b0 is equal to the y-intercept of the linear regression.
The regression coefficient b1 is the slope of the regression line. Its value is equal to the average change in the dependent variable (Y) for a unit change in the independent variable (X)
Key Ideas of Linear Regression
Correlation explains the interrelation between variables within the data.
Variance is the degree of the spread of the data.
Standard deviation is the dispersion of the mean from a data set by studying the variance’s square root.
Residual (error term) is the actual value found within the dataset minus the expected value that is predicted in linear regression.
Types of Linear Regression
There are majorly three types of Linear Regression they are:
Simple Linear Regression
Multiple Linear Regression
Polynomial Linear Regression
Simple Linear Regression
Involves one independent variable and one dependent variable.
Example: Predicting house price based on its size.
Multiple Linear Regression
Involves two or more independent variables and one dependent variable.
Example: Predicting house price based on size, location, and age of the house.
Polynomial Regression
Models a non-linear relationship by fitting a polynomial equation to the data.
Example: Predicting sales growth trends over time.
Regression Coefficient
The regression coefficient is given by the equation :
Y= B0+B1X
Where
B0 is a constant
B1 is the regression coefficient
Given below is the formula to find the value of the regression coefficient.
B1=b1 = ∑[(xi-x)(yi-y)]/∑[(xi-x)2]
Where xi and yi are the observed data sets.
And x and y are the mean value.
Importance of Regression Line
A regression line is used to describe the behaviour of a set of data, a logical approach that helps us study and analyze the relationship between two different continuous variables. Which is then enacted in machine learning models, mathematical analysis, statistics field, forecasting sectors, and other such quantitative applications. Looking at the financial sector, where financial analysts use linear regression to predict stock prices and commodity prices and perform various stock valuations for different securities. Several well-renowned companies make use of linear regressions for the purpose of predicting sales, inventories, etc.
Key Ideas of Linear Regression
Correlation explains the interrelation between variables within the data.
Variance is the degree of the spread of the data.
Standard deviation is the dispersion of mean from a data set by studying the variance’s square root.
Residual (error term) is the actual value found within the dataset minus the expected value that is predicted in linear regression.
Important Properties of Regression Line
Regression coefficient values remain the same because the shifting of origin takes place because of the change of scale. The property says that if the variables x and y are changed to u and v respectively u= (x-a)/p v=(y-c) /q, Here p and q are the constants.Byz =q/p*bvu Bxy=p/q*buv.
If there are two lines of regression and both the lines intersect at a selected point (x’, y’). The variables x and y are considered. According to the property, the intersection of the two regression lines is (x`, y`), which is the solution of the equations for both the variables x and y.
You will understand that the correlation coefficient between the two variables x and y is the geometric mean of both the coefficients. Also, the sign over the values of correlation coefficients will be the common sign of both the coefficients. So, if according to the property regression coefficients are byx= (b) and bxy= (b’) then the correlation coefficient is r=+-sqrt (byx + bxy) which is why in some cases, both the values of coefficients are negative value and r is also negative. If both the values of coefficients are positive then r is going to be positive.
The regression constant (a0) is equal to the y-intercept of the regression line and also a0 and a1 are the regression parameters.
Regression Line Formula:
A linear regression line equation is written as-
Y = a + bX
where X is plotted on the x-axis and Y is plotted on the y-axis. X is an independent variable and Y is the dependent variable. Here, b is the slope of the line and a is the intercept, i.e. value of y when x=0.
Multiple Regression Line Formula: y= a +b1x1 +b2x2 + b3x3 +…+ btxt + u
Assumptions made in Linear Regression
The dependent/target variable is continuous.
There isn’t any relationship between the independent variables.
There should be a linear relationship between the dependent and explanatory variables.
Residuals should follow a normal distribution.
Residuals should have constant variance.
Residuals should be independently distributed/no autocorrelation.
Solved Examples
1. Find a linear regression equation for the following two sets of data:
Sol: To find the linear regression equation we need to find the value of Σx, Σy, Σx
2
2
and Σxy
Construct the table and find the value
The formula of the linear equation is y=a+bx. Using the formula we will find the value of a and b
a= \[\frac{\left ( \sum_{Y}^{} \right )\left ( \sum_{X^{2}}^{} \right )-\left ( \sum_{X}^{} \right )\left ( \sum_{XY}^{} \right )}{n\left ( \sum_{x^{2}}^{} \right )-\left ( \sum_{x}^{} \right )^{2}}\]
Now put the values in the equation
\[a=\frac{25\times 120-20\times 144}{4\times 120-400}\]
a= \[\frac{120}{80}\]
a=1.5
b= \[\frac{n\left ( \sum_{XY}^{} \right )-\left ( \sum_{X}^{} \right )\left ( \sum_{Y}^{} \right )}{n\left ( \sum_{x^{2}}^{} \right )-\left ( \sum_{x}^{} \right )^{2}}\]
Put the values in the equation
\[b=\frac{4\times 144-20\times 25}{4\times 120-400}\]
b=\[\frac{76}{80}\]
b=0.95
Hence we got the value of a = 1.5 and b = 0.95
The linear equation is given by
Y = a + bx
Now put the value of a and b in the equation
Hence equation of linear regression is y = 1.5 + 0.95x


FAQs on Linear Regression Explained with Formula and Graph
1. What is linear regression in statistics?
Linear regression is a statistical method used to model the relationship between a dependent variable and one or more independent variables using a straight line. In simple linear regression, the relationship is represented as y = mx + c, where:
- y = dependent variable
- x = independent variable
- m = slope of the line
- c = y-intercept
2. What is the formula for simple linear regression?
The formula for simple linear regression is y = a + bx, where b is the slope and a is the intercept. The slope is calculated as:
b = Σ[(x − x̄)(y − ȳ)] / Σ[(x − x̄)²]
and the intercept is:
a = ȳ − b x̄
- x̄ = mean of x-values
- ȳ = mean of y-values
3. How do you calculate the line of best fit?
The line of best fit is calculated using the least squares method, which minimizes the sum of squared errors. Follow these steps:
- Find the means x̄ and ȳ
- Compute b = Σ[(x − x̄)(y − ȳ)] / Σ[(x − x̄)²]
- Compute a = ȳ − b x̄
- Write the regression equation as y = a + bx
4. What is the difference between simple and multiple linear regression?
The main difference is that simple linear regression uses one independent variable, while multiple linear regression uses two or more.
- Simple linear regression: y = a + bx
- Multiple linear regression: y = a + b₁x₁ + b₂x₂ + ... + bₙxₙ
5. What does the slope mean in linear regression?
The slope in linear regression represents the rate of change of the dependent variable with respect to the independent variable. It is denoted by b in the equation y = a + bx.
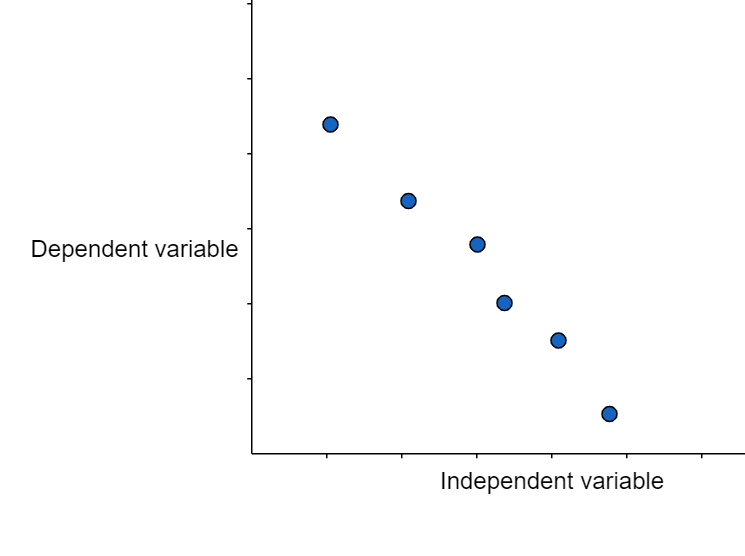
- If b > 0, the relationship is positive.
- If b < 0, the relationship is negative.
- If b = 0, there is no linear relationship.
6. What is the coefficient of determination (R²)?
The coefficient of determination, R², measures how well the regression model explains the variation in the dependent variable. It is calculated as R² = 1 − (SSres / SStot).
- R² = 1: perfect fit
- R² = 0: no explanatory power
7. Can you give a simple example of linear regression?
Yes, a simple example is predicting marks based on study hours using the equation y = 5 + 3x. Suppose a student studies for 4 hours:
- Substitute x = 4
- y = 5 + 3(4)
- y = 5 + 12 = 17
8. What are the assumptions of linear regression?
Linear regression relies on key statistical assumptions for valid results. These include:
- Linearity – relationship between variables is linear
- Independence – observations are independent
- Homoscedasticity – constant variance of errors
- Normality – residuals are normally distributed
9. How is linear regression used in real life?
Linear regression is used in real life to predict outcomes and analyze trends based on data. Common applications include:
- Forecasting sales and revenue
- Predicting house prices
- Estimating demand in economics
- Analyzing relationships in scientific research
10. What are common mistakes in linear regression?
Common mistakes in linear regression include misinterpreting results or ignoring assumptions. Key errors include:
- Assuming correlation implies causation
- Ignoring outliers that distort the regression line
- Using linear regression for non-linear relationships
- Overfitting in multiple regression models