


How Does a Spreadsheet Work with Formulas Functions and Data Management
Working with Spread Sheet is an essential skill in computer science and information technology, especially for handling data in an organised and efficient manner. A spreadsheet is a software tool used to store, calculate, analyse, and present data in tabular form. Applications such as Microsoft Excel are widely used in schools, businesses, and research fields to perform calculations, create charts, and manage records. Understanding how to work with spreadsheets helps students develop logical thinking, data analysis skills, and practical knowledge required in real-world computing tasks.
Definition and Meaning
Working with Spread Sheet in computer science refers to the process of creating, editing, formatting, and analysing data using spreadsheet software like Microsoft Excel. It involves entering data into rows and columns, applying formulas, and generating meaningful results.
- Spreadsheet - A software application that organises data in tabular form.
- Cell - The intersection of a row and a column where data is entered.
- Workbook - A spreadsheet file containing one or more worksheets.
- Worksheet - A single page within a workbook.
- Formula - An expression used to perform calculations.
How It Works / Working Principle
The Working with Spread Sheet working principle is based on organising data in a grid structure made of rows and columns. Each cell can store text, numbers, or formulas. The spreadsheet automatically recalculates results when data is modified.
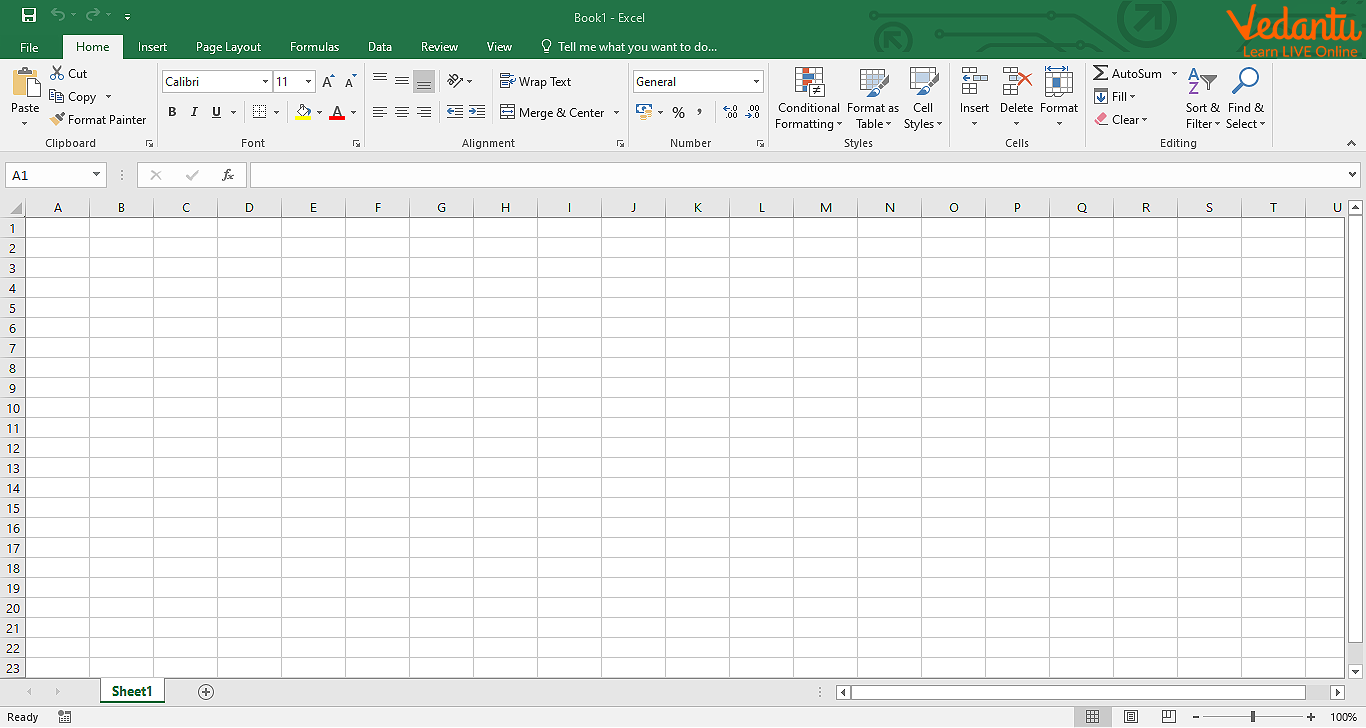
- Open the spreadsheet application such as Microsoft Excel.
- Enter data into cells using rows (numbered) and columns (lettered).
- Apply formulas like SUM, AVERAGE, or IF for calculations.
- Format cells for better presentation such as currency, date, or percentage.
- Create charts and graphs to visualise data.
- Save the workbook for future use.
The automatic recalculation feature ensures that when input data changes, all dependent results update instantly.
Types and Classification
Different Working with Spread Sheet types are based on the software platform used:
Types of Spreadsheet Software
| Type | Platform | Example |
|---|---|---|
| Desktop Spreadsheet | Installed on Computer | Microsoft Excel |
| Online Spreadsheet | Web Browser Based | Google Sheets |
| Open Source Spreadsheet | Free and Community Developed | LibreOffice Calc |
Each type allows users to perform similar data operations but differs in accessibility, collaboration features, and cost.
Components and Structure
Understanding the structure is important when learning Working with Spread Sheet in computer science.
- Rows - Horizontal lines identified by numbers.
- Columns - Vertical lines identified by letters.
- Cells - Individual boxes such as A1, B2.
- Formula Bar - Displays and edits cell content.
- Ribbon - Contains commands and tools.
- Sheets - Multiple pages within a workbook.
Syntax and Example
General Formula Syntax
=FUNCTION_NAME(Cell1:Cell2)Example
=SUM(A1:A5)This formula adds all values from cell A1 to A5. The equal sign indicates a formula, SUM is the function name, and A1:A5 represents the cell range.
Features and Characteristics
- Automatic calculations using formulas and functions.
- Data sorting and filtering options.
- Chart and graph creation.
- Conditional formatting for highlighting data.
- Support for large datasets.
- Data validation and protection features.
Advantages
- Easy data organisation and management.
- Quick and accurate calculations.
- Improves productivity in offices and schools.
- Supports data analysis and decision making.
- Visual representation through charts.
Disadvantages / Limitations
- Errors in formulas can lead to incorrect results.
- Not suitable for extremely large databases compared to DBMS.
- Requires basic knowledge to use advanced features.
- Data security risks if not properly protected.
Applications and Use Cases
Working with Spread Sheet applications are widely seen in different industries and daily activities.
- Maintaining student records and attendance.
- Financial accounting and budgeting.
- Inventory management in businesses.
- Data analysis and reporting.
- Creating invoices and payroll sheets.
Quick Facts About Working With Spread Sheet
| Category | Details |
|---|---|
| Type | Application Software |
| Common File Extension | .xlsx |
| Developed By | Microsoft Corporation |
| Used For | Data Calculation and Analysis |
| Platform Support | Windows, Mac, Web |
Spreadsheet software plays a major role in modern computing environments.
Interesting Facts About Working With Spread Sheet
- The first electronic spreadsheet was VisiCalc, released in 1979.
- Microsoft Excel is one of the most widely used spreadsheet applications worldwide.
- Spreadsheets can handle thousands to millions of rows depending on the software version.
- Functions like IF and VLOOKUP are commonly used for logical operations.
- Spreadsheets support automation through macros.
- They are often used as lightweight data analysis tools.
Conclusion
Working with Spread Sheet is a fundamental concept in computer science that enables efficient data management, calculation, and analysis. By understanding its structure, formulas, and features, students can perform complex tasks with accuracy and speed. Spreadsheet tools are widely used in education, business, and research, making them an essential skill in the digital world. Learning this topic builds a strong foundation for data handling and analytical thinking in modern computing.
FAQs on Working With Spreadsheet Concepts and Practical Usage
1. What is a spreadsheet in Computer Science?
A spreadsheet is a software application used to organize, calculate, and analyze data in tabular form using rows and columns.
- Data is stored in cells identified by row numbers and column letters (e.g., A1).
- Common spreadsheet software includes Microsoft Excel, Google Sheets, and LibreOffice Calc.
2. What are the main components of a spreadsheet?
The main components of a spreadsheet include structural and functional elements that help manage and process data efficiently.
- Workbook: A file containing one or more worksheets.
- Worksheet: A grid of rows and columns where data is entered.
- Cell: The intersection of a row and column.
- Formula Bar: Used to enter or edit data and formulas.
3. How does a spreadsheet work?
A spreadsheet works by storing data in cells and performing automatic calculations using formulas and functions.
- Users enter data such as numbers, text, or dates into cells.
- Formulas like =A1+B1 perform calculations.
- Results update automatically when input data changes.
4. What are formulas and functions in a spreadsheet?
In a spreadsheet, formulas and functions are used to perform calculations and data processing operations.
- Formula: A user-defined expression like =A1+A2.
- Function: A predefined formula such as SUM(), AVERAGE(), or IF().
- Functions help in data analysis and exam-oriented problem solving.
5. What are the common uses and applications of spreadsheets?
Spreadsheets are widely used for data management, analysis, and reporting in academic and professional environments.
- Budget planning and financial calculations.
- Data analysis using charts and graphs.
- Student result processing and database-like record keeping.
6. What are the advantages and disadvantages of using spreadsheets?
Spreadsheets offer powerful data processing features but also have certain limitations in large-scale systems.
- Advantages: Easy calculations, data visualization, automation with formulas.
- Disadvantages: Error-prone manual entry, limited scalability compared to database management systems.
7. What is the difference between a spreadsheet and a database?
A spreadsheet is mainly used for calculations and small datasets, while a database is designed for structured data storage and management.
- Spreadsheets use cells and formulas for analysis.
- Databases use DBMS, SQL, and structured tables with relationships.
- Databases are better for large-scale applications and multi-user systems.
8. What are charts and data visualization tools in spreadsheets?
Charts in a spreadsheet are graphical representations of data used for better analysis and presentation.
- Common chart types include bar chart, line chart, and pie chart.
- Used in data analysis, business reports, and exam projects.
- Helps in identifying trends and patterns visually.
9. What are sorting and filtering operations in spreadsheets?
Sorting and filtering in a spreadsheet help organize and display specific data efficiently.
- Sorting arranges data in ascending or descending order.
- Filtering displays only selected records based on conditions.
- Useful for database-like operations and data analysis tasks.
10. Why is learning to work with spreadsheets important for exams and interviews?
Working with spreadsheets is important because it builds data handling, logical thinking, and problem-solving skills.
- Commonly asked in school, college, and competitive exams.
- Frequently required in job interviews for roles in IT, finance, and data analysis.
- Helps in understanding basic concepts of data structures, algorithms, and data processing.