


Class 7 Maths NCERT Exemplar Solutions Chapter 3 Data Handling
In Examples 1 to 3, there are four options, out of which only one is correct. Write the correct answer.
Example 1: The range of the data 14, 6, 12, 17, 21, 10, 4, 3
(a) 21
(b) 17
(c) 18
(d) 11
Ans: (c) 18
Range = maximum value – minimum value
Range = 21 – 3 = 18
Example 2: The mode of the data 23, 26, 22, 29, 23, 29, 26, 29, 22, 23 is
(a) 23 and 29
(b) 23 only
(c) 29 only
(d) 26 only
Ans: (a) 23 and 29
The number 23 and 29 repeated 3 times
Example 3: The median of the data 40, 50, 99, 68, 98, 60, 94 is
(a) 40
(b) 60
(c) 68
(d) 99
Ans: (c) 68
On rearranging the given data in ascending order we get, 40, 50, 60, 68, 94, 98, 99
The middle most term or number is 68
In Examples 4 and 5, fill in the blanks to make the statements true.
Example 4: The mean of first five prime numbers is
Ans: The first five prime numbers are 2, 3, 5, 7 and 11
$Mean = \dfrac{{Sum\,\,of\,\,5\,\,prime\,\,numbers}}{5}$
$ = \dfrac{{2 + 3 + 5 + 7 + 11}}{5}$
$ = \dfrac{{28}}{5}$
$ = 5.6$
Example 5: The probability of getting a number greater than 2 on throwing a die once is
Ans: The total outcomes = 6
If the outcome is greater than 2, then number of possibilities = 4
$P = \dfrac{4}{6} = \dfrac{2}{3}$
In Examples 6,7 and 8, state whether the statements are True or False.
Example 6: The mode of the observations 23, 26, 15, 12, 28, 38, 19, 23, 26, 23 is 28
Ans: False. The number 26 is repeated twice, so 26 is mode and 28 appears only once.
Example 7:
In the above table
(a) The most popular size is 17.
(The number of sweater 17 tells us that 42 is the most common size. Thus, 17 is not mode rather 42.)
Ans:
(a) False, because the number 17 indicates the number of sweaters sold and it is not related to the size.
(b) 17 is the median for above data.
Ans: False, 17 is not the middle most term.
Example 8: Median of the data: 4, 5, 9, 2, 6, 8, 7 is 2
Ans: False.
On arranging the data in ascending order we get 2, 4, 5, 6, 7, 8, 9, therefore the median is 6
Example 9: Find the median of the data: 3, 11, 7, 2, 5, 9, 9, 2, 10, 15, 7
Ans: Arranged in ascending order we have 2, 2, 3, 5, 7, 7, 9, 9, 10, 11, 15.
Since the number of observations is odd, the middle most value is the median. The middle most value is 7, so median = 7.
Example10: Find the median of the data: 21, 15, 6, 25, 18, 13, 20, 9, 8, 12
Ans: Arranging the given data in ascending order 6, 8, 9, 12, 13, 15, 18, 20, 21, 25
Since number of observations is even, the median is given by finding the average or mean of the two middle most observations
So, median$ = \dfrac{{13 + 15}}{2} = \dfrac{{28}}{2} = 14$
Example 11: The cards bearing letters of the word "MATHEMATICS" are placed in a bag. A card is taken out from the bag without looking into the bag (at random).
(a) How many outcomes are possible when a letter is taken out of the bag at random?
Ans: (a) There are 11 letters in the word “MATHEMATICS”. Therefore the number of outcomes = 11.
(b) What is the probability of getting
(i) M?
Ans: (i) Probability of getting ‘M’ , In a word MATHEMATICS, the letter M is repeated twice. Therefore the probability is $\dfrac{2}{{11}}$
(ii) Any vowel?
Ans: The number of vowels in MATHEMATICS is 4. Probability of getting a vowel $ = \dfrac{4}{{11}}$
(iii) Any consonant?
Ans: The number of consonants is 7. Probability of getting a consonant $ = \dfrac{7}{{11}}$
(iv) X?
Ans: There is no letter X in the word MATHEMATICS. Probability of getting X = $\dfrac{0}{{11}}$
Example 12: If the mean of 26, 28, 25, x, 24 is 27, find the value of x.
Ans: $Mean = \dfrac{{Sum\,\,of\,\,all\,\,observations}}{{Number\,\,of\,\,observations}}$
$27 = \dfrac{{26 + 28 + 25 + x + 24}}{5}$
$135 = 103 + x$
$x = 135 - 103$
$x = 32$
The value of x is 32
Example 13: The mean of 10 observations was calculated as 40. It was detected on rechecking that the value of 45 was wrongly copied as 15 . Find the correct mean.
Ans:
$Mean = \dfrac{{Sum\,\,of\,\,all\,\,observations}}{{Number\,\,of\,\,observations}}$
$40 = \dfrac{{Sum\,\,of\,\,all\,\,observations}}{{10}}$
$400 = Sum\,\,of\,\,all\,\,observations$
The sum of all observations = 400
But this is an incorrect sum, since one of the observations was copied wrongly.
Correct sum = Incorrect sum – Incorrect observation + correct observation
= 400-15+45 =430
$Correct\,mean = \dfrac{{Correct\,\,sum}}{{Number\,\,of\,\,observations}}$
$ = \dfrac{{430}}{{10}} = 43$
Example 14: The median of observations 11, 12, 14, 18, x+2, 20, 22, 25, 61 arranged in ascending order is 21 . Find the value of x.
Ans: The data is arranged already in ascending order and the number of observations are 9 and the middle most term is x+2 , therefore the median is x+2.
$21 = x + 2$
$x = 21 - 2$
$x = 19$
Example 15: Study the double bar graph given below and answer the questions that follow:
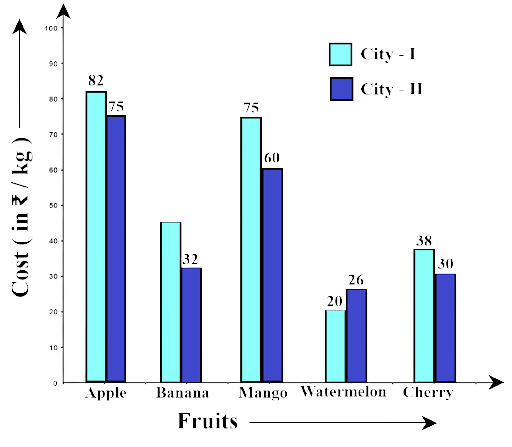
Ans: The double bar graph gives information about the cost of different fruits per kg in Cities I and II.
(b) Name the fruits for which the cost of 1 kg is greater in City I as compared to City II.
Ans: The fruits are Apple, Banana, Mango and Cherry
(c) What is the difference of rates for apples in both the cities?
Ans: The cost of apples in city I is Rs. 82 and in city II Rs. 75. The difference is Rs. 82 – rs. 75 = Rs. 7
(d) Find the ratio of the cost of mangoes per kg in City I to the cost of mangoes per kg in City II.
Ans: The ratio is Rs. 75 : Rs. 60 = 5:4
Example 16: The following double bar graph represents test matches results summary for Cricket Team of country X against different countries:
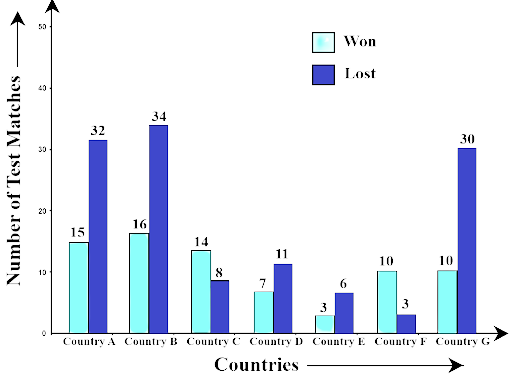
(a) Which country has managed maximum wins against country X?
Ans: Country B has managed maximum wins against country X.
(b) The difference between the number of matches won and lost is highest for which country against country X?
Ans: The difference between the number of matches won and lost is highest against country X is Country G
(c) Number of wins of country E is the same as the number of losses of which country against country X?
Ans: Number of wins of country of country E is same as number of losses of Country F against country X
Exercise
1. Let x, y, z be three observations. The mean of these observations is
(a) $\dfrac{{x \times y \times z}}{3}$
(b) $\dfrac{{x + y + z}}{3}$
(c) $\dfrac{{x - y - z}}{3}$
(d) $\dfrac{{x \times y + z}}{3}$
Ans: (b) $\dfrac{{x + y + z}}{3}$
Sol: By the definition of mean
$Mean = \dfrac{{Sum\,of\,all\,observation}}{{Total\,number\,of\,observation}}$
$\therefore \,\,\,Mean = \dfrac{{x + y + z}}{3}$
2. The number of trees in different parks of a city is 33, 38, 48, 33, 34, 34, 33 and 24. The mode of this data is
(a) 24
(b) 34
(c) 33
(d) 48
Ans: (c) 33.
Sol: Consider the given set of data i.e.,
The number of trees in different parks of a city is: 33, 38, 48, 33, 34, 34, 33 and 24.
The mode of data is 33 because of the frequent occurrence of 33.
3. Which measures of central tendency get affected if the extreme observations on both the ends of a data arranged in descending order are removed?
(a) Mean and mode
(b) Mean and Median
(c) Mode and Median
(d) Mean, Median and Mode
Ans: (a) Mean and Mode.
By the definition the mean of a data set is the ratio of the sum of all observations to the total number of observations. The Sum of observations and the total number of observations will alter if the extreme values are removed. As a result, the mean will change.
A mode is the most frequent observation in any dataset. If the extreme value of such values which occurs frequently, can affect it, they are removed. As a result, the mode will change.
Median is the mid-value of any dataset of observations. When the extreme values are removed, the mid-value remains unchanged. As a result, the median will remain unchanged.
4. The range of the data: 21, 6, 17, 18, 12, 8, 4, 13 is
(a) 17
(b) 12
(c) 8
(d) 15
Ans: (a) 17.
In given set of data,
The highest observation$ = 21$
The lowest observation$ = 4$.
$\therefore $ Range of data $ = 21 - 4 = 17$.
5. The median of the data: 3, 4, 5, 6, 7, 3, 4 is
(a) 5
(b) 3
(c) 4
(d) 6
Ans: (c) 4.
Rearrange the given data in ascending order, we get
3, 3, 4, 4, 5, 6, 7, it is odd in numbers.
$\therefore $ The middle term is 4.
6. Out of 5 brands of chocolates in a shop, a boy has to purchase the brand which is most liked by children. What measure of central tendency would be most appropriate if the data is provided to him?
(a) Mean
(b) Mode
(c) Median
(d) Any of the three
Ans: (b) Mode.
As we all know, mode is a measure of central tendency that is used to determine what occurs most often.
7. There are 2 aces in each of the given set of cards placed face down. From which set are you certain to pick the two aces in the first go?
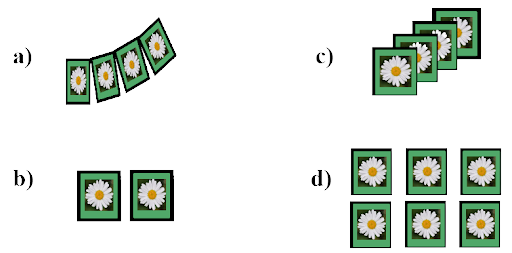

Ans: (b)
In option (b), in essence two cards are placed face down, and the probability of picking up two aces is assured.
8. In the previous question, what is the probability of picking up an ace from set (d)?
(a) $\dfrac{1}{6}$
(b) $\dfrac{2}{6}$
(c) $\dfrac{3}{6}$
(d) $\dfrac{4}{6}$
Ans: (b) $\dfrac{2}{6}$
Set (d) has total 6 cards and we have to pick 2 aces cards
$\therefore $ Probability of picking 2 aces is $ = \dfrac{2}{6}$.
9. The difference between the highest and the lowest observations in a data is its
(a) Frequency
(b) Width
(c) Range
(d) Mode
Ans: (a) Frequency
We know that the definition of the Range is the difference between the lowest and highest values.
$\therefore $ Range = Highest observation – Lowest observation
10. In a school, only 2 out of 5 students can participate in a quiz. What is the chance that a student picked at random makes it to the competition?
(a) 20%
(b) 40%
(c) 50%
(d) 30%
Ans: (b) 40%
In a school, out of 5 students we have to pick 2 students for quiz competition.
By the definition of probability$ = \dfrac{2}{5}$
$\therefore $ Required percentage$ = \dfrac{2}{5} \times 100 = 40\% $.
11. Some integers are marked on a board. What is the range of these integers?
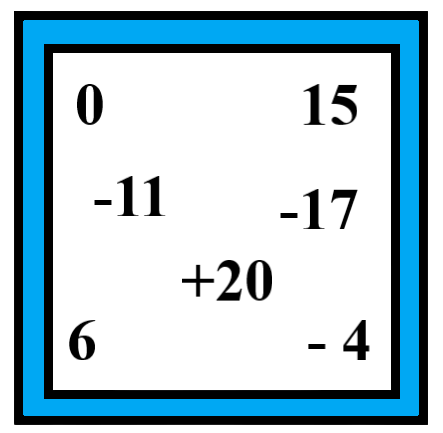
(a) 31
(b) 37
(c) 20
(d) 3
Ans: (b) 37.
In given integers,
The highest observation$ = 20$
The lowest observation$ = - 17$.
$\therefore $ Range of data $ = 20 - \left( { - 17} \right) = 20 + 17 = 37$.
12. On tossing a coin, the outcome is
(a) only head
(b) only tail
(c) neither head nor tail
(d) either head or tail
Ans: (d) either head or tail.
When a coin is tossed, there are only two possibilities of outcomes: it is either head or tail.
13. The mean of three numbers is 40. All the three numbers are different natural numbers. If the lowest is 19, what could be the highest possible number of remaining two numbers?
(a) 81
(b) 40
(c) 100
(d) 71
Ans: (a) 81.
Let us consider, highest number be $y$ and middle number be $x$.
By the definition
$Mean = \dfrac{{Sum\,of\,all\,observation}}{{Total\,number\,of\,observation}}$
$\therefore \,\,\,Mean = \dfrac{{x + y + z}}{3}$
Given, the value of mean is 40 and the lowest number is 19.
$ \Rightarrow \,\,\,40 = \dfrac{{x + y + 19}}{3}$
$ \Rightarrow \,\,\,x + y + 19 = 120$
$ \Rightarrow \,\,\,x + y = 120 - 19$
$ \Rightarrow \,\,\,x + y = 101$
$\because \,\,19 < x$, $19 < y$ and $y > x$
$\therefore $ Maximum value of $y$ could be $81 + 20 = 101$ and
$81 > 19$, $81 > 20$ and $20 > 19$.
14. Khilona earned scores of 97, 73 and 88 respectively in her first three examinations. If she scored 80 in the fourth examination, then her average score will be
(a) increased by 1
(b) increased by 1.5
(c) decreased by 1
(d) decreased by 1.5
Ans: (d) decreased by 1.5
Mean of the first three examinations scores
$ \Rightarrow \,\,\dfrac{{97 + 73 + 88}}{3} = \dfrac{{258}}{3} = 86$
Now, Mean of the first four examinations scores
$ \Rightarrow \,\,\dfrac{{97 + 73 + 88 + 80}}{4} = \dfrac{{338}}{4} = 84.5$
$\therefore $ The average score of khilona will be decreased by $86 - 84.5 = 1.5$
15. Which measure of central tendency best represents the data of the most popular politician after a debate?
(a) Mean
(b) Median
(c) Mode
(d) Any of the above
Ans: (c) Mode
By the definition, mode is a measure of central tendency that is used to determine what occurs most often.
16. Which of the following has the same mean, median and mode?
(a) 6, 2, 5, 4, 3, 4, 1
(b) 4, 2, 2, 1, 3, 2, 3
(c) 2, 3, 7, 3, 8, 3, 2
(d) 4, 3, 4, 3, 4, 6, 4
Ans: (d) 4, 3, 4, 3, 4, 6, 4
(a) Rearrange the given data in ascending order, we get
1, 2, 3, 4, 4, 5, 6
$ \Rightarrow \,\,Mean = \dfrac{{1 + 2 + 3 + 4 + 4 + 5 + 6}}{7} = \dfrac{{25}}{7} = 3.57$
Mode$ = 4$, because it occurs two times.
Median$ = 4$.
$\therefore $ Mean is not equal to mode and median.
(b) Rearrange the given data in ascending order, we get
1, 2, 2, 2, 3, 3, 4
$ \Rightarrow \,\,Mean = \dfrac{{1 + 2 + 2 + 2 + 3 + 3 + 4}}{7} = \dfrac{{17}}{7} = 2.43$
Mode$ = 2$, because it occurs three times.
Median$ = 2$.
$\therefore $ Mean is not equal to mode and median.
(c) Rearrange the given data in ascending order, we get
2, 2, 3, 3, 3, 7, 8
$ \Rightarrow \,\,Mean = \dfrac{{2 + 2 + 3 + 3 + 3 + 7 + 8}}{7} = \dfrac{{31}}{7} = 4.43$
Mode$ = 3$, because it occurs three times.
Median$ = 3$.
$\therefore $ Mean is not equal to mode and median.
(d) Rearrange the given data in ascending order, we get
3, 3, 4, 4, 4, 4, 6
$ \Rightarrow \,\,Mean = \dfrac{{3 + 3 + 4 + 4 + 4 + 4 + 6}}{7} = \dfrac{{28}}{7} = 4$
Mode$ = 4$, because it occurs four times.
Median$ = 4$.
$\therefore $ Mean, mode and median all are equal
In Questions 17 to 31, fill in the blanks to make the statements true.
17. The difference between the highest and the lowest observations of a data is called _____________.
Ans: Range.
18. The mean of a data is defined as ____________.
Ans: Ratio of the sum of all observations to the total number of observations.
i.e., $Mean = \dfrac{{Sum\,of\,all\,observation}}{{Total\,number\,of\,observation}}$
19. In a set of observations, the observation that occurs the most often is called ____________.
Ans: Mode.
20. In a given data, arranged in ascending or descending order, the middle most observation is called _________.
Ans: Median.
21. Mean, Median, Mode are the measures of ______________.
Ans: Central tendency.
22. The probability of an event, which is certain to happen, is ___________.
Ans: 1
An event whose occurrence is $100\% $ sure, those events are known as certain events. The probability of such an event is always 1.
23. The probability of an event, which is impossible to happen, is __________.
Ans: 0
The impossible events can’t occur. So, the probability of an impossible event is 0
24. When a die is thrown, the probability of getting a number less than 7 is _________.
Ans: 1
When a die is thrown the possible outcomes are 1, 2, 3, 4, 5, 6 all are less than 7
Number of sides in die$ = 6$
$\therefore $ Probability of getting a number less than 7 $ = \dfrac{{Number\,less\,than\,7}}{{Number\,of\,sides\,in\,die}} = \dfrac{6}{6} = 1$
25. In Throwing a die the number of possible outcomes is ________.
Ans: 6
The die contains 6 numbers namely 1, 2, 3, 4, 5 and 6 thus, the possible number of outcomes is 6.
26. ____________ can be used to compare two collections of data.
Ans: A double bar graph.
A double bar graph is used for comparing the two collections of data on the same topic.
27. The representation of data with bars of uniform width is called _________.
Ans: Bar graph.
A bar graph is a graphical representation of data using rectangular bars of equal width drawn vertically or horizontally with equal spacing between them and different heights. So, the representation of data with bars of uniform width is called a Bar graph.
28. If the arithmetic mean of 8, 4, x, 6, 2, 7 is 5, then the value of x is _______.
Ans: 3.
Given, the mean of data 8, 4, x, 6, 2, 7 is 5.
By the definition,
$Mean = \dfrac{{Sum\,of\,all\,observation}}{{Total\,number\,of\,observation}}$
$ \Rightarrow \,\,\,5 = \dfrac{{8 + 4 + x + 6 + 2 + 7}}{6}$
$ \Rightarrow \,\,\,5 = \dfrac{{27 + x}}{6}$
$ \Rightarrow \,\,\,27 + x = 30$
$ \Rightarrow \,\,\,x = 30 - 27$
$\therefore \,\,\,x = 3$
29. The median of any data lies between the _____ and _____ observations.
Ans: The median of any data lies between the minimum and maximum observations.
30. Median is one of the observations in the data if the number of observations is ________.
Ans: Median is one of the observations in the data if the number of observations is odd.
31. Rohit collected the data regarding weights of students of his class and prepared the following table:
A student is to be selected randomly from his class for some competition. The probability of selection of the student is highest whose weight is in the interval ____________.
Ans: Weight is in the interval between 52 – 55. Because, more or maximum number of students comes under this interval.
In Questions 32 to 49, state whether the statements are True or False.
32. If a die is thrown, the probability of getting a number greater than 6 is 1.
Ans: False. Because, when a die is thrown the possible outcomes are 1, 2, 3, 4, 5, 6. Since no outcome is greater than 6. Hence, the probability of getting a number greater than 6 is zero.
33. When a coin is tossed, there are 2 possible outcomes.
Ans: True. When a coin is tossed there are 2 possibilities of outcomes either head or tail.
34. If the extreme observations on both the ends of a data arranged in ascending order are removed, the median gets affected.
Ans: False. The removal of extreme observation affects mean and mode but median is not affected.
35. The measures of central tendency may not lie between the maximum and minimum values of data.
Ans: False. All measures of central tendency lie between the maximum and minimum values of data.
36. It is impossible to get a sum of 14 of the numbers on both dice when a pair of dice is thrown together.
Ans: True. when a die is thrown the possible outcomes are 1, 2, 3, 4, 5, 6. If both dice get 6, the maximum sum of the number is 12.
37. The probability of the spinning arrow stopping in the shaded region in given figure is $\dfrac{1}{2}$.

Ans: True.
There are 4 total parts in the given figure in which 2 parts are shaded.
By the definition of probability
$\therefore $ Probability$ = \dfrac{2}{4} = \dfrac{1}{2}$.
38. A coin is tossed 15 times and the outcomes are recorded as follows : H T T H T H H H T T H T H T T. The chance of occurrence of a head is 50 percent.
Ans: False.
The total number of occurrence $ = 15$
The number of outcomes were head $ = 7$
$\therefore $ The Percentage of getting head$ = \dfrac{7}{{15}} \times 100 = 46.6\% $.
39. Mean, Median and Mode may be the same for some data.
Ans: True.
Example: The Mean, Median and Mode of the data 2, 2, 2, 2, 2 is
Mean$ = \dfrac{{2 + 2 + 2 + 2 + 2}}{5} = \dfrac{{10}}{5} = 2$
Mode$ = 2$, Because 2 occurs maximum times.
Median$ = 2$.
Mean, Median and Mode may be the same for some data but not for all data.
Hence, the given statement is true.
40. The probability of getting an ace out of a deck of cards is greater than 1.
Ans: False.
Total number of cards in the deck are 52.
The number of ace cards in the deck are 4.
If an ace is removed
Probability$ = \dfrac{4}{{52}} = \dfrac{1}{{13}}$ is less than 1.
41. Mean of the data is always from the given data.
Ans: False.
The Mean of given data is defined as the sum of all observations by the total number of observations. So, it doesn’t depend upon the given data.
42. Median of the data may or may not be from the given data.
Ans: True,
The median of the data is defined as the middle number in an ascending or descending order of given data. But it may or may not be from the given data.
43. Mode of the data is always from the given data.
Ans: True.
Mode is defined as the observations that occur the highest numbers of times. Therefore, it is one of the observations in the data.
44. Mean of the observations can be lesser than each of the observations.
Ans: False.
The mean of the data may be greater than some of the observations in data.
45. Mean can never be a fraction.
Ans: False.
The Mean of given data is defined as the sum of all observations by the total number of observations which can also be a fraction.
46. Range of the data is always from the data.
Ans: False.
The Range is defined as the difference between the highest and lowest observations. It may be or may not be from the given observations of data.
47. The data 12, 13, 14, 15, 16 has every observation as mode.
Ans: True.
Given data is 12, 13, 14, 15, and 16.
Here, all the observations occur one time.
Therefore, everyone is taken as mode.
48. The range of the data 2, –5, 4, 3, 7, 6 would change if 2 was subtracted from each value in the data.
Ans: False.
Given data is 2, –5, 4, 3, 7, 6
Highest observation = 7
Lowest observation = –5
Range = Highest observation – Lowest observation
$\therefore $ Range$ = 7 - \left( { - 5} \right) = 7 + 5 = 12$
After subtraction 2 from each value,
The data becomes 0, -7, 2, 1, 5, 4
Now, Range will be
$ \Rightarrow \,\,5 - \left( { - 7} \right) = 5 + 7 = 12$
Therefore, the range is the same for both the cases.
49. The range of the data 3, 7, 1, –2, 2, 6, –3, –5 would change if 8 was added to each value in the data.
Ans: False.
Given data is 3, 7, 1, –2, 2, 6, –3, –5
Highest observation = 7
Lowest observation = –5
Range = Highest observation – Lowest observation
$\therefore $ Range$ = 7 - \left( { - 5} \right) = 7 + 5 = 12$
After adding 8 from each value,
The data becomes 11, 15, 9, 6, 10, 14, 5, 3
Now, Range will be
$ \Rightarrow \,\,15 - 3 = 12$
Therefore, the range is the same for both the cases.
50. Calculate the Mean, Median and Mode of the following data:
5, 10, 10, 12, 13. Are these three equal?
Ans: True.
Given data is 5, 10, 10, 12, 13
Mean $ = \dfrac{{5 + 10 + 10 + 12 + 13}}{5} = \dfrac{{50}}{5} = 10$
Mode$ = 10$, because it occurs two times.
Median$ = 10$.
$\therefore $ Mean, mode and median all are equal
51. Find the mean of the first ten even natural numbers.
Ans: First ten even natural numbers are:
2, 4, 6, 8, 10, 12, 14, 16, 18, 20
By the definition,
$Mean = \dfrac{{Sum\,of\,all\,observation}}{{Total\,number\,of\,observation}}$
Mean $ = \dfrac{{2 + 4 + 6 + 8 + 10 + 12 + 14 + 16 + 18 + 20}}{{10}} = \dfrac{{110}}{{10}} = 11$
$\therefore $ Mean of the first ten even natural numbers is 11.
52. The data consists of heights (in cm) of 50 children. What do you understand by mode for the data?
Ans: Mode is the data that occurs most frequently or which is repeated more in number in the mentioned set.
53. A car seller collects the following data of cars sold in his shop.
(a) Which colour of the car is most liked?
Ans: Black colour of car is most liked because the number of cars sold of black cars is more when compared to others.
(b) Which measure of central tendency was used in
Ans: Mode is used in (a) part or question.
54. The marks in a subject for 12 students are as follows: 31, 37, 35, 38, 42, 23, 17, 18, 35, 25, 35, 29.
For the given data, find the
(a) Range
Ans: Rearranging the data in ascending order, we get 17, 18, 23, 25, 29, 31, 35, 35, 37, 38, 42
(a) Range = highest value – lowest value
Range = 42 – 17 = 25
(b) Mean
Ans: Mean $ = \dfrac{{17 + 18 + 23 + 25 + 29 + 31 + 35 + 35 + 35 + 37 + 38 + 42}}{{12}}$
$ = \dfrac{{365}}{{12}}$
$ = 30.41$
(c) Median
Ans: Median, here the observation are even in number
$ = \dfrac{{31 + 35}}{2}$
$ = \dfrac{{66}}{2}$
$ = 33$
(d) Mode
Ans: The mode is 35 because it has occurred frequently 3 times.
55. The following are weights (in kg) of 12 people. 70, 62, 54, 57, 62, 84, 75, 59, 62, 65, 78, 60
(a) Find the mean of the weights of the people.
Ans:
Rearranging the data into ascending order, we get 54, 57, 59, 60, 62, 62, 62, 65, 70, 75, 84
Mean $ = \dfrac{{54 + 54 + 57 + 59 + 60 + 62 + 62 + 62 + 65 + 70 + 75 + 84}}{{12}}$kg
$ = \dfrac{{788}}{{12}}$kg
$ = 65.6$ kg
(b) How many people weigh above the mean weight?
Ans: 4 people have a weight, above the mean weight.
(c) Find the range of the given data.
Ans: Range = 84 – 54 = 30 kg
56. Following cards are put facing down:

(a) a vowel
Ans:
Total cards = 5
(a) All the given cards are vowels. Hence, the chance of drawing out of a vowel is 1 .
(b) A or I
Ans: Probability of getting card, A or I $ = \dfrac{2}{5}$
(c) a card marked U
Ans: Probability of getting a card which is marked as U $ = \dfrac{1}{5}$
(d) a consonant
Ans: No consonant was given. Hence, the chance of drawing out a consonant is 0.
57. For the given data given below, calculate the mean of its median and mode. 6, 2, 5, 4, 3, 4, 4, 2, 3
Ans:
Rearranging the data in ascending order, we get 2, 2, 3, 3, 4, 4, 4, 5, 6
The given number of observations is odd.
Hence, median is 4 because of middle most observation and mode is 4 also due to frequently occurring of number 4
The mean is
$Mean = \dfrac{{Median + Mode}}{2}$
$ = \dfrac{{4 + 4}}{2}$
$ = 4$
58. Find the median of the given data if the mean is 4.5, 5, 7, 7, 8, x, 5, 4, 3, 1, 2
Ans:
The given data is 5, 7, 7, 8, x, 5, 4, 3, 1, 2
The mean of the following data is 4.5
$4.5 = \dfrac{{5 + 7 + 7 + 8 + x + 5 + 4 + 3 + 1 + 2}}{{10}}$
$45 = x + 42$
$x = 45 - 42$
Re-substituting the value of x in given data and rearranging the observation 1, 2, 3, 3, 4, 5, 5, 7, 7, 8 are even in number
Therefore, median$ = \dfrac{{4 + 5}}{2} = \dfrac{9}{2} = 4.5$
59. What is the probability of the sun setting tomorrow?
Ans: The sun sets every evening. Hence, the probability of the sun setting tomorrow is 1.
60. When a spinner with three colours is rotated, which colour has more chance to show up with an arrow than the others?
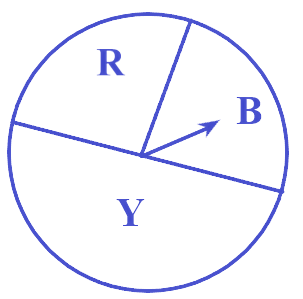
Colour Y has more chances to show up with an arrow because it has more portions (region) than other two colours in the figure.
61. What is the probability that a student chosen at random out of 3 girls and 4 boys is a boy?
Ans:
Total number of students = 3 + 4 = 7
Number of boys = 4
Probability $ = \dfrac{{Number\,\,of\,\,boys}}{{Total\,\,students}}$
Probability $ = \dfrac{4}{7}$
62. The letters written on paper slips of the word MEDIAN are put in a bag. If one slip is drawn randomly, what is the probability that it bears the letter D?
Ans:
The word MEDIAN consists of 6 letters. The letter D occurs only at once
Probability $ = \dfrac{{The\,\,letter\,\,D\,\,occurs}}{{Total\,\,letters\,\,in\,MEDIAN}}$
Probability $ = \dfrac{1}{6}$
63. Classify the following events as certain to happen, impossible to happen, may or may not happen:
(a) Getting a number less than 1 on throwing a die
Ans:
(a) No, there is not any number available on dice which is less than 1.
Hence, getting a number less than 1 is impossible.
(b) Getting head when a coin is tossed
Ans: When a coin tossed two outcomes are possible that are head or tail.
Therefore, getting head when a coin is tossed may or may not happen.
(c) A team winning the match
Ans: A team can lose or win the match because winning the match is uncertain.
(d) Christmas will be on 25 December.
Ans: Christmas always comes on 25 December.
(e) Today the moon will not revolve around the earth.
Ans: As we know, the moon always revolves around the earth.
Therefore, it is impossible that the moon does not revolve around the earth.
(f) A ball thrown up in the air will fall down after some time.
Ans: If a ball is thrown up in the air it would come down due to gravity.
64. A die was thrown 15 times and the outcomes recorded were 5, 3, 4, 1, 2, 6, 4, 2, 2, 3, 1, 5, 6, 1, 2. Find the mean, median and mode of the data.
Ans: Rearranging the data into ascending order, we get 1, 1, 1, 2, 2, 2, 2, 3, 3, 4, 4, 5, 5, 6, 6
$Mean = \dfrac{{1 + 1 + 1 + 2 + 2 + 2 + 3 + 3 + 4 + 4 + 5 + 5 + 6 + 6 + }}{{15}}$
$ = \dfrac{{47}}{{15}} = 3.13$
The numbers of observations are odd. Hence, median = 3
Mode = 2 (due to frequent occurring of number 4)
65. Find the mean of the first six multiples of 4.
Ans:
The first 6 multiples of 4 are 4, 8, 12, 16, 20 and 24
$mean = \dfrac{{4 + 8 + 12 + 16 + 20 + 24}}{6}$
$ = \dfrac{{84}}{6} = 14$
66. Find the median of the first nine even natural numbers.
Ans:
The first nine even natural numbers are 2, 4, 6, 8, 10, 12, 14, 16, 18
The observations are odd in number. The n value is 9. The median is 5th observation.
Hence, the median is 10.
67. The mean of three numbers is 10. The mean of the other four numbers is 12. Find the mean of all the numbers.
Ans:
The mean of 3 numbers are 10.
Means of 4 numbers = 12
$10 = \dfrac{{Sum\,\,of\,3\,observation}}{3}$
$ \Rightarrow Sum\,\,of\,\,observation = 30$…(1)
$12 = \dfrac{{Sum\,\,of\,4\,observation}}{4}$
$ \Rightarrow Sum\,\,of\,\,observation = 48$…(2)
From equation 1 and 2, we get
Sum of 7 observation = 30+48 = 78
Mean $ = \dfrac{{78}}{7} = 11.14$
68. Find the mode of the given data: 10, 8, 4, 7, 8, 11, 15, 8, 4, 2, 3, 6, 8Ans:
Rearranging the given observation into ascending order 2, 3, 4, 4, 6, 7, 8, 8, 8, 8, 10, 11, 15
The mode is 8 that occurred 4 times in the data.
69. Given below are heights of 15 boys of a class measured in cm: 128, 144, 146, 143, 136, 142, 138, 129, 140, 152, 144, 140, 150, 142, 154. Find
(a) The height of the tallest boy.
Ans: The given observations should be arranged in ascending order 128, 129, 136, 138, 140, 140, 142, 143, 144, 144, 146, 150, 152, 154
(a) The tallest boy is 154 cm in height.
(b) The height of the shortest boy.
Ans: The shortest boy is 128 cm in height.
(c) The range of the given data.
Ans: Range = 154 – 128 = 26 cm
(d) The median height of the boys.
Ans: When observations are odd in number the middle most term is taken as the median. Therefore, middle height = 142 cm
70. Observe the data and answer the questions that follow: 16, 15, 16, 16, 8, 15, 17
(a) Which data value can be put in the data so that the mode remains the same?
Ans: The given data is 16, 15, 16, 16, 8, 15, 17
(a) 16 occurs 3 times in the data Therefore, Mode = 16
If we place 15 in the data, the mode will change as 15 occurs two times.
Hence, 6 or 8 or 17 can also be put in the data so that mode will remain the same.
(b) At least how many and which value(s) must be put in to change the mode to 15 ?
Ans: The mode will be 15 because it occurs 4 times at least.
Hence, two times 15 should be added in the data to make the mode as 15.
(c) What is the least number of data values that must be put in to change the mode to 17? Name them.
Ans: 17 comes only once in the data
Therefore, 17 should be put in the data at least 3 times to change the mode as 17 .
71. Age (in years) of 6 children of two groups are recorded as below:
(a) Find the mode and range for each group.
Ans: For group A;
Mode is 7 and 10 because both come two times. Range = 10 – 7 = 3 years
For group B;
12 occurs 3 times, hence 12 is the mode.
Now,
Range = 12 – 7 = 5 years
(b) Find the range and mode if the two groups are combined together
Ans: Now we combine the group A and the group B and arrange them in the ascending order. 7, 7, 7, 8, 9, 9, 10, 10, 11, 12, 12, 12 .
7 and 12 occur most frequently 3 times in the above-given data.
Therefore, the mode is 7 and 12 years
Range = Highest age - Lowest age = 12 – 7 = 5 years
72. Observe the given bar graph carefully and answer the questions that follow.
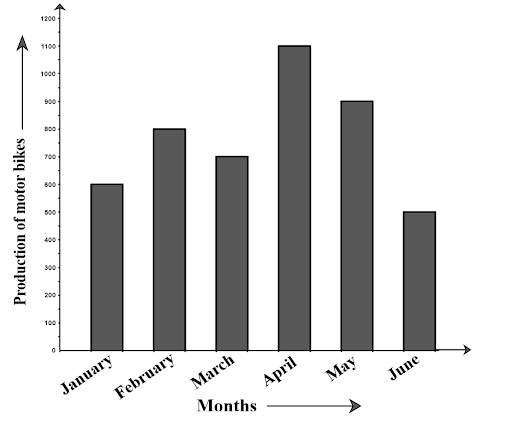
Ans: The bar graph shows the information about production of motor bikes manufactured by the XYZ automobiles Ltd. from January to June.
(b) How many motorbikes were produced in the first three months?
Ans: The production of the motor-bikes in the first three months = 600 + 800 + 700 = 2100
(c) Calculate the increase in production in May over the production in January.
Ans: Production in January = 600
Production in May = 900
Therefore, the increment in the production in May over January = 900 – 600 = 300
(d) In which month the production was minimum and what was it?
Ans: The minimum production was in June and it was 500.
(e) Calculate the average (mean) production of bikes in 6 months.
Ans: Average production = $\dfrac{{600 + 800 + 700 + 1100 + 900 + 500}}{6}$
$ = \dfrac{{4600}}{6} = 766.66 \approx 767$
73. The bar graph given below shows the marks of students of a class in a particular subject: Study the bar graph and answer the following questions:
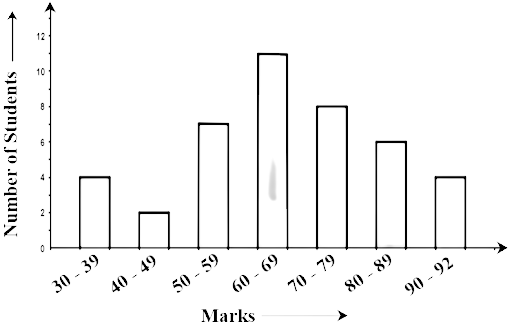
Ans: 4 students has failed, they obtained less than 40 marks (at 30-39)
(b) How many students got marks from 50 to 69 ?
Ans: 7 and 11 students obtained the marks (50-59) and (60 – 69) respectively.
Therefore, 7 + 11 = 18
18 students obtained 60 to 69 marks.
(c) How many students scored 90 marks and above?
Ans: 4 students secured 90 and above marks.
(d) If students who scored marks above 80 are given merits then how many merit holders are there?
Ans: 6 students got 80 to 89 marks and 4 students got 90 to 92 .
Hence, 6+4 = 10 students are the merit holders.
(e) What is the strength of the class?
Ans: Total number of students in the class = 4 + 2+7+11+8+6+4+=42
74. Study the bar graph given below and answer the questions that follow:
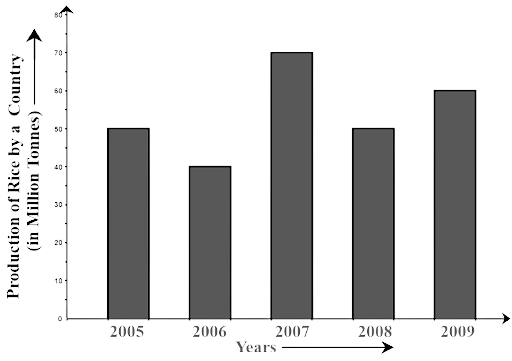
(a) What information does the above bar graph represent?
Ans: The information about the production of rice in a country during the years from 2005 to 2009 is represented by the bar graph.
(b) In which year was production the least?
Ans: The least production was in the year 2006
(c) After which year was the maximum rise in production?
Ans: The rise in the production in the year 2007
Therefore, after 2006 the production had a maximum rise.
(d) Find the average production of rice during the 5 years.
Ans: The average production
$ = \dfrac{{50 + 40 + 70 + 50 + 60}}{5}\,\,milliontones$
$ = \dfrac{{270}}{5}\,\, = 54\,\,milliontones$
(e) Find the difference of rice production between 2006 and 2008.
Ans: 40 tons of rice was produced in 2006, 50 tons of rice was produced in 2008
Therefore the difference = 50 – 40 = 10 million tones
75. Study the bar graph given below and answer the questions that follow:
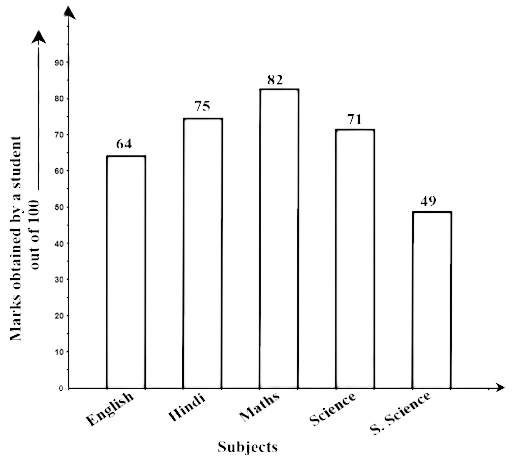
Ans: The information about marks, which are secured by students, is represented using the bar graph.
(b) In which subject is the student very good?
Ans: 82 is the highest mark obtained by a student in Mathematics.
Therefore, we can say that the students are good in Maths.
(c) Calculate the average marks of the student.
Ans: Average marks $ = \dfrac{{64 + 75 + 82 + 71 + 49}}{5}$
(d) If 75 and above marks denote a distinction, then name the subjects in which the student got distinction.
Ans: The student got 82 marks in maths and 75 marks in Hindi.
Therefore, the student got distinction in Maths and Hindi.
(e) Calculate the percentage of marks the student got out of 500 .
Ans: Total marks secured by the student = 64+75+82+71+49 = 341
Hence, percentage of marks $ = \dfrac{{341}}{{500}} = 68.2\% $
76. The bar graph given below represents the circulation of newspapers (dailies) in a town in six languages (the figures are approximated to hundreds).
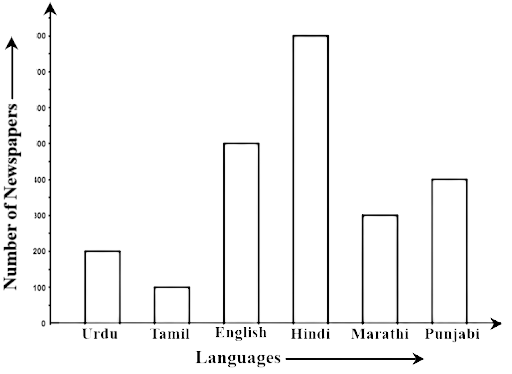
Study the bar graph and answer the following questions:
(a) Find the total number of newspapers read in Hindi, Punjabi, Urdu, Marathi and Tamil.
Ans: Total number of newspapers read in Punjabi, Hindi, Marathi, Urdu and Tamil = 800+400+200+300+100 = 1800
(b) Find the excess number of newspapers read in Hindi rather than those in English.
Ans: Number of newspapers read in Hindi = 800.
Number of newspaper read in English = 500
Therefore, the difference is 800 – 500 = 300
Extra newspaper in Hindi language than in English language.
(c) Name the language in which the least number of newspapers are read.
Ans: Newspapers of the Tamil language are read less.
(d) Write the total circulation of newspapers in the town.
Ans: Total number of newspapers in the town = 800+500+400+300+200+100 = 2300
77. Study the double bar graphs given below and answer the following questions:
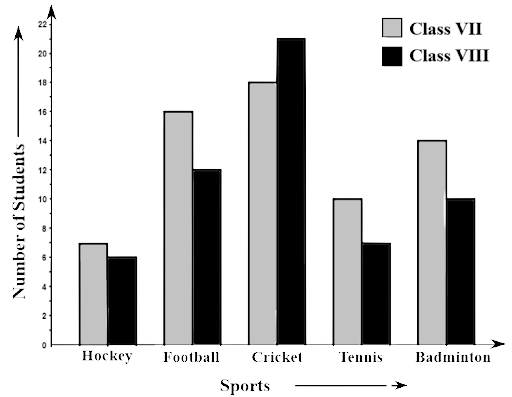
Ans: Cricket is the most liked game by Class VIII students. Because the highest value is shown in the above-given bar graph.
(b) How many students of Class VII like Hockey and Tennis in all?
Ans: In Class VII, the number of students who like Hockey = 7. In Class VII, the number of students who like Tennis = 10
Hence, the number of students who likes both is 10+7=17
(c) How many students are there in Class VII?
Ans: Number of students in Class VII = 7+10+16+18+14 = 65
(d) For which sport is the number of students of Class VII less than that of Class VIII?
Ans: The number of students in Class VII is less than Class VIII in the essence of cricket.
(e) For how many sports students of Class VIII are less than Class VII?
Ans: The number of students in Class VIII is less than Class VII in the essence of Hockey, Tennis, Badminton and Football.
(f) Find the ratio of students who like Badminton in Class VII to students who like Tennis in Class VIII.
Ans: Total number of students who like Badminton in Class VII is 14.
In Class VIII, the number of students who like Tennis is 7.
Hence, the ratio$ = \dfrac{{14}}{7} = \dfrac{2}{1}$
i.e., 2:1
78. Study the double bar graph shown below and answer the questions that follow:
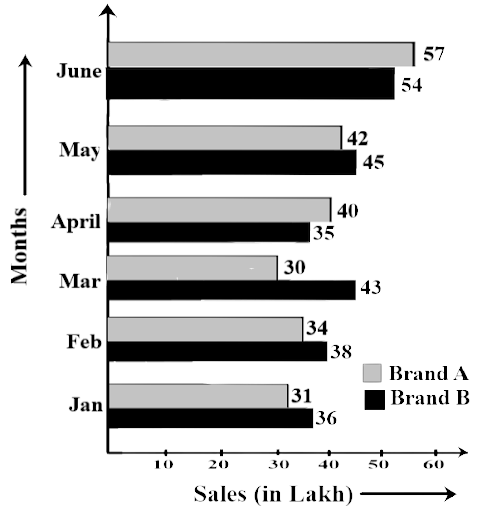
Ans: The double bar graph gives information about the comparison of sales between two brands A and B.
(b) In which month sales of Brand A decreased as compared to the previous month?
Ans: The sales of brand A are less in March than in February. Therefore, the sale of brand A decreased as compared to B.
(c) What is the difference in sales of both the Brands for the month of June?
Ans: Sales of brand A is 57 lakh in the month of June. Sales of brand B is 54 lakh
Difference in sales is 57-54 = 3 lakh
(d) Find the average sales of Brand B for the six months.
Ans: Average sales of brand B
$ = Rs.\left( {\dfrac{{36 + 38 + 43 + 35 + 45 + 54}}{6}} \right)lakh$
$ = Rs.\left( {\dfrac{{251}}{6}} \right)lakh = 41.83\,\,lakh$
(e) List all months for which the sales of Brand B were less than that of Brand A.
Ans: The sale of brand B is less than brand A in the months of April and June.
(f) Find the ratio of sales of Brand A as compared to Brand B for the month of January.
Ans: The sale of brand A in the month of January is 31 lakh
The sale of brand B in the month of January is 36 lakh
The ratio $ = \dfrac{{31}}{{36}}$
i.e., 31:36
79. Study the double bar graph shown below and answer the questions that follow:
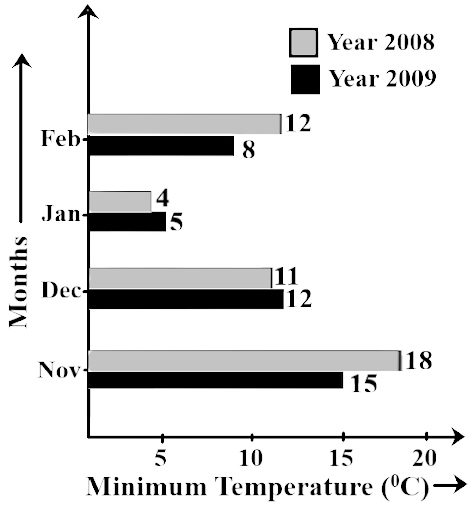
Ans: The comparison of the minimum temperature of the year 2008 and 2009, during the month from November to February
(b) Calculate the ratio of minimum temperatures in the year 2008 to the year 2009 for the month of November.
Ans: -18 degree Celsius is the minimum temperature in the year 2008 in the month of November and minimum temperature in November of the year 2009 = 15 degree Celsius
The ratio is given as $ = \dfrac{{18}}{{15}} = \dfrac{6}{5}$
$i.e.,\,6:5$
(c) For how many months was the minimum temperature in the year 2008 greater than that of 2009? Name those months.
Ans: November and February are the two months of the year 2008 were greater than that of the year 2009
(d) Find the average minimum temperature for the year 2008 for the four months.
Ans: The average minimum temperature in 2008
$ = \dfrac{{{{(18 + 11 + 4 + 12)}^0}C}}{4}$
$ = \dfrac{{{{45}^0}C}}{4}$
$ = {11.25^0}C$
(e) In which month is the variation in the two temperatures maximum?
Ans: In the month of February, the variation in the two temperatures is maximum.
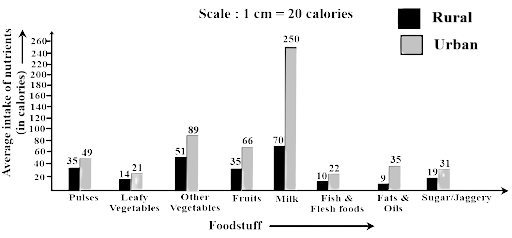
80. The following table shows the average intake of nutrients in calories by rural and urban groups in a particular year. Using a suitable scale for the given data, draw a double bar graph to compare the data.
Ans:
81. Study the double bar graph and answer the questions that follow:
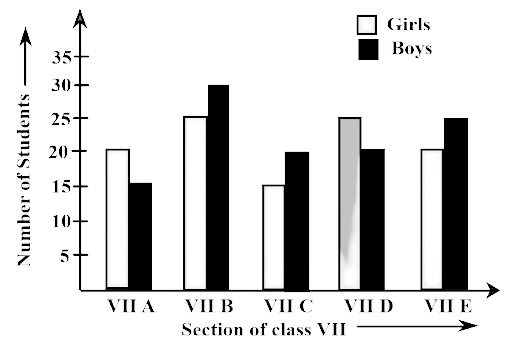
(a) What information does the double bar graph represent?
Ans: The double bar graph provides information about the number of boys and girls, as students of different sections of Class VII.
(b) Find the total number of boys in all sections of Class VII.
Ans: Total number of boys in all sections of class VIII = 15+30+20+20+25+= 110
(c) In which sections, the number of girls is greater than the number of boys?
Ans: The number of girls is greater than the number of boys in section A and D.
(d) In which section, the number of boys is the maximum?
Ans: The number of boys is the maximum in section B.
(e) In which section, the number of girls is the least?
Ans: The number of girls is the least in section C.
82. In a public library, the following observations were recorded by the librarian in a particular week:
(a) Draw a double bar graph choosing an appropriate scale.
Ans:
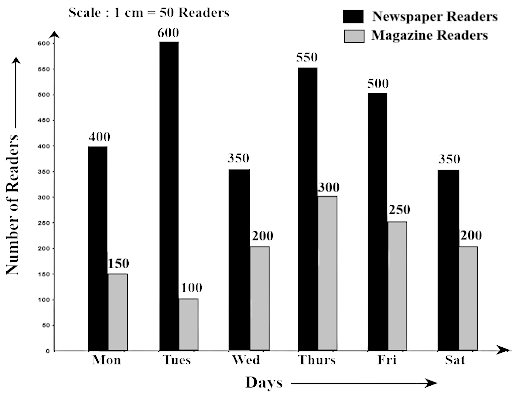
(b) On which day, the number of readers in the library was maximum?
Ans: Readers on Monday = 400+150 = 550
Readers on Tuesday = 600+100 = 700
Readers on Wednesday = 350+200 = 550
Readers on Thursday = 550+300 = 850
Readers on Friday = 550+250 = 750
Readers on Saturday = 350+200 = 550
Therefore, the number of readers is maximum on Thursday.
(c) What is the mean number of magazine readers?
Ans: Total number of magazine readers = 150+100+200+300+250+200 = 1200
$Mean = \dfrac{{1200}}{6} = 200$
83. Observe the following data:
(a) Draw a double bar graph choosing an appropriate scale. What do you infer from the bar graph?
Ans:
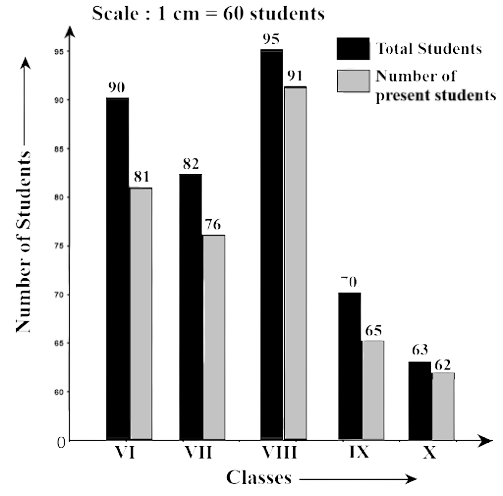
(b) Which class has the maximum number of students?
Ans: The maximum numbers of students are in Class VIII.
(c) In which class, the difference of total students and number of students present is minimum?
Ans: The difference between the total students and their presence in Class VI = 90 – 81 = 9
The difference between the total students and their presence in Class VII = 82 – 76 = 6 The difference between the total students and their presence in Class VIII = 95 – 91 = 4
The difference between the total students and their presence in Class IX= 70 – 65 = 5
The difference between the total students and their presence in Class X = 63 - 62 = 1
We can observe here, Class X has the minimum difference between the students and their presence.
(d) Find the ratio of the number of students present to the total number of students of Class IX.
Ans: Total number of students in Class IX = 70.
Number of students present in Class IX = 65.
Hence, the ratio $ = \dfrac{{65}}{{70}} = \dfrac{{13}}{{14}}$
$ = 13:14$
(e) What percent of Class VI students were absent?
Ans: Total number of students in Class VI = 90
Number of student present in Class VI=81
Number of students absent in the Class VI = 90 – 81 = 9
Hence, the ratio $ = \dfrac{{65}}{{70}} = \dfrac{{13}}{{14}}$$ = 13:14$
Therefore, the percentage of absent student $ = \dfrac{9}{{100}} \times 100 = 9\% $
84. Observe the given data:
(a) Draw a bar graph to represent the above given information.
Ans:
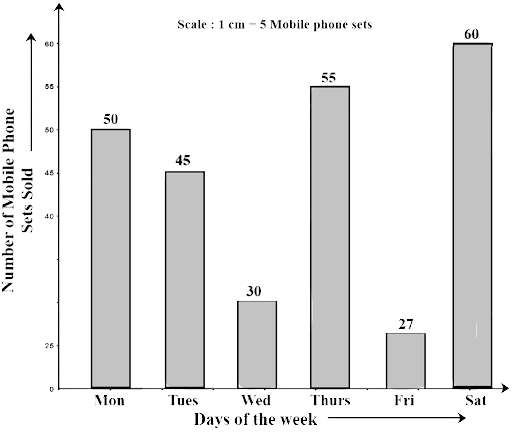
(b) On which day of the week was the sales maximum?
Ans: The sales were maximum on Saturday.
(c) Find the total sales during the week.
Ans: Total sale during the week is 45+50+30+55+27+60 = 267
(d) Find the ratio of the minimum sale to the maximum sale.
Ans: The minimum sale = 27 and the maximum sale = 60
The required ratio of minimum sale to the maximum sale
$ = \dfrac{{27}}{{60}} = \dfrac{9}{{20}}$
$i.e.,\,9:20$
(e) Calculate the average sale during the week.
Ans: $Average\,\,sale = \dfrac{{Total\,\,sales\,\,during\,\,the\,\,week}}{{Total\,\,number\,\,of\,\,days}}$
$ = \dfrac{{267}}{6} = 44.5$
(f) On how many days of the week was the sale above the average sales?
Ans: 4 days in a week has the above value of sale than the average sale that is Monday, Tuesday, Thursday, and Saturday.
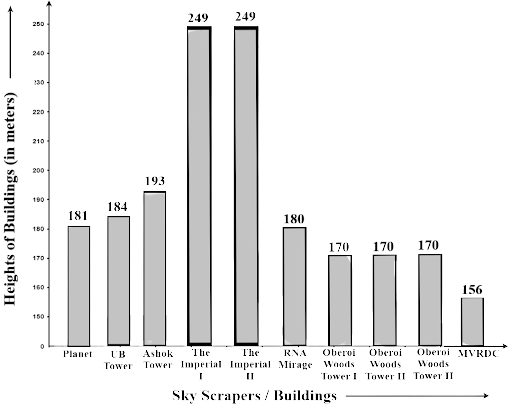
85. Below is a list of 10 tallest buildings in India.
This list ranks buildings in India that stand at least 150 m (492 ft) tall, based on standard height measurement. This includes spires and architectural details but does not include antenna marks. Following data is given as per the available information till 2009. Since new buildings are always under construction, go on-line to check for taller buildings.
Use the information given in the table about skyscrapers to answer the following questions:
(a) Find the height of each storey of the three tallest buildings and write them in the following table:
Ans:
(b) The average height of one storey for the buildings given in (a) is ?
Ans: The average height of one storey for the buildings
$ = \left( {\dfrac{{3.9 + 4.15 + 4.15}}{3}} \right)$
$ = \dfrac{{122}}{3}$
$ = 4.06\,\,m$
(c) Which city in this list has the largest percentage of skyscrapers?
What is the percentage?
Ans: The total number of skyscrapers = 10
The total number of skyscraper in Mumbai = 9
Hence, the percentage of skyscrapers in Mumbai$ = \dfrac{9}{{10}} \times 100 = 90\% $
(d) What is the range of data?
Ans: Range = highest value - Lowest value = 249 m – 156 m = 93 m
(e) Find the median of the data.
Ans: Rearranging the height into ascending order 156, 170, 170, 170, 180, 181, 184, 193, 249, 249.
The data is in even number
$Median = \dfrac{{180 + 181}}{2}$
$ = \dfrac{{361}}{2} = 180.5\,\,m$
(f) Draw a bar graph for given data.
Ans: The graph is given as
86. The marks out of 100 obtained by Kunal and Soni in the Half Yearly Examination are given below:
(a) Draw a double bar graph by choosing appropriate scale.
Ans:
(a)
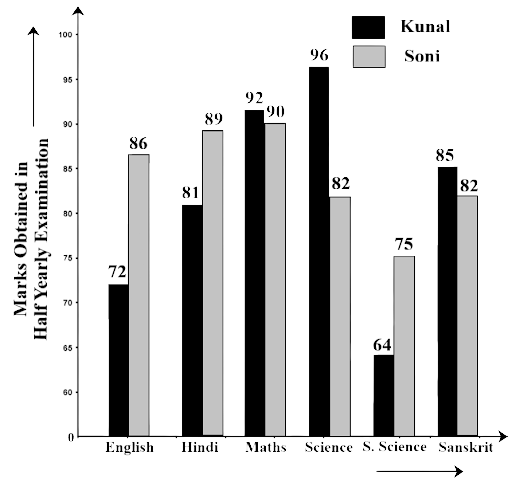
(b) Calculate the total percentage of marks obtained by Soni.
Ans: The total marks secured by Soni = 86+89+90+82+75+82 = 504
Total maximum marks $6 \times 100 = 600$
Hence, the percentage of marks she got$ = \dfrac{{504}}{{600}} \times 100 = 84\% $
(c) Calculate the total percentage of marks obtained by Kunal.
Ans: The total marks secured by Kunal = 72+81+92+96+64+85 = 490
Total maximum marks $6 \times 100 = 600$
Hence, the percentage of marks he got $ = \dfrac{{490}}{{600}} \times 100 = 81.6\% $
(d) Compare the percentages of marks obtained by Kunal and Soni.
Ans: The ratio of soni’s marks to the Kunal’s marks $ = \dfrac{{81.6}}{{84}} = \dfrac{{816}}{{840}}$
$ = \dfrac{{34}}{{35}}$
$i.e.,\,34:35$
(e) In how many subjects did Soni get more marks than Kunal?
Which are those subjects?
Ans: Soni gets more marks than Kunal in three subjects that are Hindi, English, and Social science.
(f) Who got more marks in S. Science and what was the difference of marks?
Ans: Soni got more marks in S. science and difference of marks is 75 – 64 = 11
(g) In which subject the difference of marks was maximum and by how much?
Ans: Difference of marks in Hindi = 89 – 81 = 8
Difference of marks in English = 86 – 72 = 14
Difference of marks in Science = 96 – 82 = 14
Difference of marks in Maths = 92 -90 = 2
Difference of marks in S. Science = 89 – 81 = 8
Difference of marks in Sanskrit = 85 – 82 = 3
Hence, the differences of marks were maximum by 14 marks in English and Science.
87. The students of Class VII have to choose one club from Music, Dance, Yoga, Dramatics, Fine arts and Electronics clubs. The data given below shows the choices made by girls and boys of the class. Study the table and answer the questions that follow:
(a) Draw a double bar graph using appropriate scale to depict the above data.
Ans:
(a)
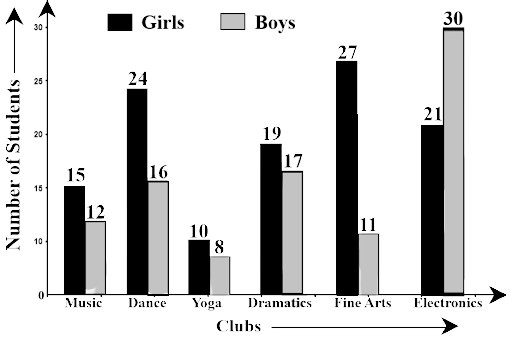
Ans: Total number of girls in the Class VII = 15 + 24 + 10 + 19 + 27 + 21 = 116
Total number of boys in the Class VII = 12 + 16 + 8 + 17 + 11 + 30 = 94
Therefore the total number of students = 116 + 94 = 210
(c) Which is the most preferred club by boys?
Ans: The boys are preferred, electronics club mostly
(d) Which is the least preferred club by girls?
Ans: The girls minimum times preferred the Yoga club
(e) For which club the difference between boys and girls is the least?
Ans: The difference in the numbers between boys and girls for a Music club = 15 – 12 =3
The difference in the numbers between boys and girls for a Dance club = 24 – 16 = 8
The difference in the numbers between boys and girls for a Yoga club = 10 – 8 = 2
The difference in the numbers between boys and girls for a Dramatics club = 19 – 17 = 2
The difference in numbers between boys and girls for an Electronics club = 30 -21 = 9
Hence, the difference between boys and girls is the least for Dramatics and Yoga clubs.
(f) For which club is the difference between boys and girls the maximum?
Ans: The difference between boys and girls is the larger for Fine Arts clubs
88. The data given below shows the production of motor bikes in a factory for some months of two consecutive years.
Study the table given above and answer the following questions:
(a) Draw a double bar graph using appropriate scale to depict the above information and compare them.
Ans:
(a) The graph is
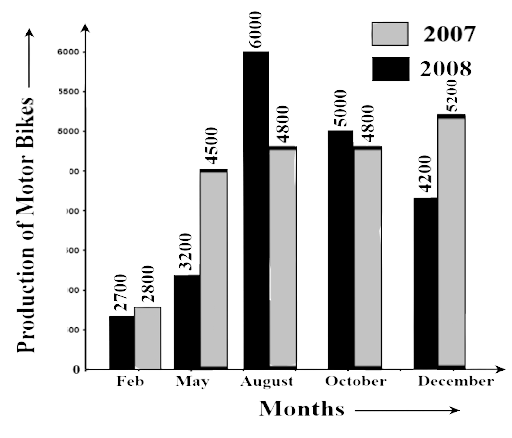
(b) In which year was the total output the maximum?
Ans: Total output in the year 2007 = 2800+4500+4800+4800+5200 = 22100
Total output in the year 2008 = 2700+3200+6000+5000+4200 = 21100
Therefore, the maximum output was in the year 2007.
(c) Find the mean production for the year 2007.
Ans: Total production during the year 2007 = 22100
Hence, mean production $ = \dfrac{{21100}}{5} = 4420$
(d) For which month was the difference between the productions for the two years the maximum?
Ans: Differences between the productions for February = 2800 – 2700 = 100
(e) In which month for the year 2008, the production was the maximum?
Ans: August.
(f) In which month for the year 2007, the production was the least?
Ans: February.
89. The table below compares the population (in hundreds) of 4 towns over two years:
Study the table and answer the following questions:
(a) Draw a double bar graph using appropriate scale to depict the above information.
Ans:
(a) The graph is given as
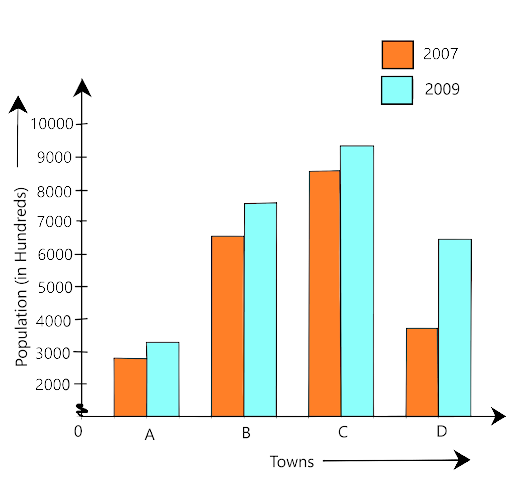
(b) In which town was the population growth maximum?
Ans: Population growth in town A = 3200 – 2900 =300
Population growth in town B = 7500 – 6400 = 1100
Population growth in town C = 9200 – 8300 = 900
Population growth in town D = 6300 – 4600 = 1700
Therefore, in a town D the population growth is maximum.
(c) In which town was the population growth least?
Ans: The population growth is minimum in town A.
90. The table below gives the data of tourists visiting 5 hill stations over two consecutive years. Study the table and answer the questions that follow:
(a) Draw a double bar graph to depict the above information using appropriate scale.
Ans:
(a) The graph is given as
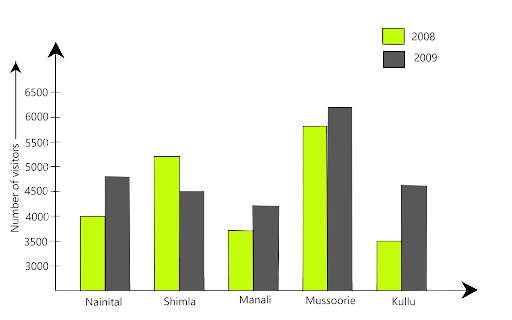
Ans: The maximum number of tourists visited Mussoorie in the year 2008.
(c) Which hill station was visited by the least number of tourists in 2009?
Ans: The minimum number of tourists visited Manali in the year 2009.
(d) In which hill stations was there an increase in the number of tourists in the year 2009?
Ans: In Nainital, Manali, Mussoorie and Kullu there was an increase in the number of tourists in the year 2009.
91. The table below gives the flavours of ice cream liked by children (boys and girls) of a society.
Study the table and answer the following questions:
(a) Draw a double bar graph using appropriate scale to represent the above information.
Ans: The given data is based on the information ice cream flavours liked by children
(a) The graph is
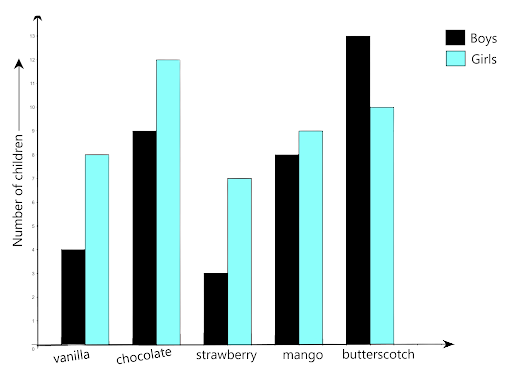
(b) Which flavour is liked the most by the boys?
Ans: By the graph or given data, the butterscotch is liked by boys
(c) How many girls are there in all?
Ans: The total number of girls = 8+ 12 + 7+ 9+ 10 = 46
(d) How many children like the chocolate flavor of ice cream?
Ans: Number of girls who likes chocolate flavour + Number of boys who likes chocolate flavour = Number of children who like chocolate flavour
= 12 + 9 = 21
Therefore 21 children likes chocolate flavour of ice cream
(e) Find the ratio of children who like strawberry flavour to vanilla flavour of ice cream.
Ans: Number of children who like the strawberry flavour of ice cream = 3 +7 =10. Number of children who like vanilla flavour of ice cream = 4 + 8 = 12. the ratio is $\dfrac{{10}}{{12}}$
On simplifying we get $\dfrac{5}{6}$
Therefore the ratio of children who like strawberry flavour to vanilla flavour of ice cream is 5:6
What Do We Get To Study In NCERT Exemplar Solutions for Class 7 Mathematics Chapter 3 Data Handling?
NCERT Exemplar Solutions for Class 7 Mathematics Chapter 3 Data Management is available here. Mathematics is a subject that requires the understanding and application of logical thinking skills. In line with this, students also need to practice Maths regularly. Class 7 students are suggested to solve the NCERT Model 7 Mathematics Solution Solutions.
Chapter 3 - Data Management Solutions are available on this page. In various fields, we need information on the status of numbers. Each image of this type is called a visual. The collection of all the notes is called Data. Now, let us take a look at the key issues discussed in the NCERT Exemplar Solutions for Class 7 Maths Chapter 3.
Data Collection
Data Organization
Arithmetic Mean
Mode
Big Data Mode
Median
Use of the Bar Graph for a Different Purpose
Key Concepts and Outcomes of Data Handling
Numerical information is called Data.
The Data is organized and illustrated with diagrams for easy understanding and interpretation.
The difference between high and low visibility in a particular Data is called its Scope.
Measurement or Arithmetic Mean or meaning of the Data provided is defined as:
Mode detection occurs most often in Data.
If each value in the Data occurs at the same time (or the same number of times), it would mean that they are all modes. In some cases, we also say that this Data has no mode as none of them occurs frequently.
When the Data provided is sorted by ascending (or descending) order, then the main focus is on the Data media.
Definition, median and mode values represent the viewing group. They are also called Data centre trend trends.
Representation of Data in the form of rectangles (bars) of the same width is called Bar Graph.
A dual bar graph can be used to compare Data related to two Data.
A situation that may or may not happen, has a chance to happen.
The probability of an event that is guaranteed to happen ‘1’.
The probability of an unlikely event is ‘0 ’.
Exercise Discussion on NCERT Exemplar Solutions Mathematics Class 7 Chapter 3 - Data Management
Questions 1 to 16 are multiple-choice questions when you are given four options for one question and you must choose the correct answer. These questions are based on integers, possibilities, definitions, boundaries and mode.
Then, there are questions when a table with all the important Data is provided and it is necessary to calculate the required terms with the help of these values.
Question 53 is one of the problems when given the colour of the cars and the number of cars of each colour sold, it is necessary to find out which car is the best-selling colour and what the average inclination used or getting high sales.
There are also questions similar to question 72, in which you are given bar graphs where the x-axis represents the production of motorcycles by a hundred times and the y axis represents the first six months of the year, i.e. from January to June.
This question tests your perception, as many values are already given in the question and you just need to analyze and answer all five sub-questions.

FAQs on NCERT Exemplar for Class 7 Maths Solutions Chapter 3 Data Handling
1. What does Data Handling teach the students?
Chapter 3 Data Handling teaches the students on important topics such as Data Collection, Definition, Mode and Date Planning, these Solutions can help you deal with difficult issues easily. By choosing to study in these NCERT Solutions, you can easily identify concepts and excel at testing. Build a solid foundation with the help of NCERT Mathematics Exemplar Solutions for Class 7th Chapter 3 and pass your Exam. Therefore, finding errors and leaving any topic unanswered using these Solutions is not possible for students so doing better in tests is easy.
2. Why Should You Use NCERT Model Solutions for Chapter 3 Grade 7 Mathematics –Data Handling by Vedantu?
Vedantu’s NCERT Model Grade 3 Mathematics Solutions for 7th Grade have benefited you in that you can access them at any time and your doubts can be resolved. For questions with longer answers, we have included step-by-step solutions to understand how to solve them. We also mentioned the formulas used in the questions. All of these solutions follow the CBSE and NCERT guidelines for Class 7 Maths. Check out our exemplary solutions today and make your reading time easier. Vedantu is always curating content and questions which is necessary for the students to practice before sitting for their Exams.
3. What is a Data Organization?
In this Chapter of Data Handling, Vedantu will build your foundation for Data planning in a variety of forms. You will learn that scattered Data can lead to many issues such as misinterpretation and confusion, so the Data is organized into types of tables and graphs. You will learn to look at these tables and graphs for answers to different types of questions. You will encounter a variety of questions at work, based directly on the basics of Data planning.
4. What is Mean, Median and Mode?
These are the three important parts of the Chapter Data Handling. The definition of a specific set of Data refers to the ratio of all Data i.e. the sum of all visuals separated by a number of observations. The specific Data set mode refers to the amount of Data that is most commonly found in the Data and the Median of a particular Data set refers to the average value of that set. You will learn to use these three words as you solve your Exercise problems. They are very important when you look at the tests and they will help you to score well by solving all the Data-related questions from the Chapter.
5. What is Data Collection?
In NCERT Exemplar Class 7 of Maths Exemplar Chapter 3, you will learn about the basics and details of Data collection. You will learn that Data collection may not give you specific and specific research values but serve as the most important information for any type of research. You will find different types of Data, from the number of vehicles sold in the factory to the marks obtained by students. In this Chapter, you will learn about using Data collected for information.