


How to choose and write the correct scale in a graph with formula and examples
In Math, a scale is used to represent the relationship between the measurement of a model to the corresponding measurement of the actual objects. Without scale, there is no use of blueprints and maps. The scale helps us to represent real-world things on paper with comparatively smaller dimensions. Scale is most commonly used in maps and blueprints used for construction and buildings.
What is Scale Drawing in Math?
The scale is defined as the ratio of the length in a drawing or model to the actual length of an object in the real world.
For example, in scale drawing, anything you draw on a paper with a size of “1” would have a size of “10” in the real world. Hence, the measurement of 150 mm on the drawing would be 1500 mm in the real world.
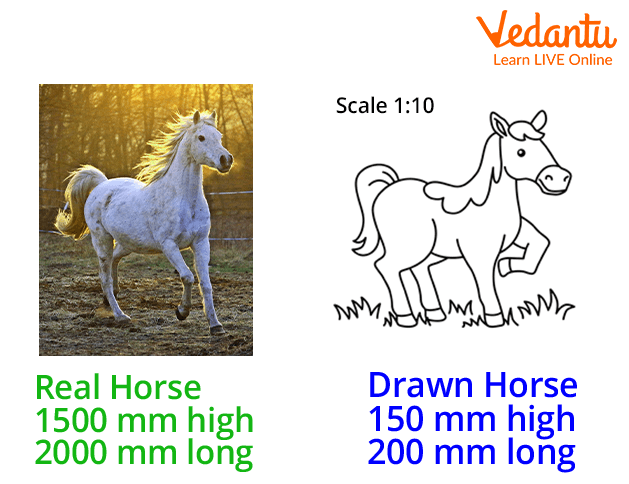
Scale Drawing Vs Original
Let’s now learn how to write scales in drawing.
How To Write Scales?
A ratio is used to write scales. In other words, the scale is written as the length in the drawing, then a colon (:), then the actual length. This implies that:
The scale of Drawing = Length of Drawing: Actual Length
Similarly, we have:
Map Scale= Map Distance: Actual Distance
How Is Scale Expressed?
A scale is expressed in the following two ways.
You can use units in scale such as 1 cm to 1 km.
Also, without clearly mentioning units such as 1: 100 000. (This implies that the real distance is 100 000 times the length of 1 unit on a drawing).
Let us understand with an example.
Example 1:
Express 5 cm to 5 m in ratio form.
Solution:
5 cm to 5 m = 5 cm : 5 m
= 5 cm : 500 cm ( 1 m = 100 cm, hence 5m = 500 cm)
= 1 : 100
Example 2:
Simplify the scale 5 mm: 2 m.
Solution:
5mm : 2 m = 5mm : 2000 mm ( 1 m = 1000 mm, hence 2 m = 2000 mm)
= 1 mm : 400 mm
= 1 : 400
Example 3:
Simplify the scale 5 cm: 4 km
Solution:
5 cm : 4 km = 5 : 400000 cm ( 1 km = 100,000 cm, hence, 4 km = 400,000 cm)
= 1cm : 80000 cm
= 1: 80000
How To Calculate The Scales of Drawings Using a Calculator?
To calculate the scales of drawing using calculator:
Divide the measurement by the scale if you want to minimize the drawing in size, or
Multiply the measurement by the scale if you want to increase the drawing in size.
Example 1:
A 100 mm line is to be drawn at a scale of 1: 5.
Solution:
To draw a 100 mm line at a scale of 1: 5 (i.e. 5 times less than its original size), we will divide 100 mm by 5.
= 100 mm 5
= 20 mm
Therefore, a 20 mm line is drawn.
Example 2:
A 100 mm line is to be drawn at a scale of 5 : 1.
Solution:
To draw a 100 mm line at a scale of 5: 1 (i.e. 5 times more than its original size), we will multiply 100 mm by 5.
= 100 mm 5
= 500 mm
Therefore, a 500 mm line is drawn.
How To Interpret Scale Drawing?
We can easily interpret scale drawing if the required information is given. Let us consider an example that represents how a scale is used to prepare the blueprint of a house and how to calculate and interpret the required dimensions.
Example: To prepare the blueprint of a house, Hitesh has used a scale of 1:100. The dimensions of the master bedrooms in the floor plan are represented as 6 units by 4 units. Find the actual dimensions of the master bedroom.
Solution:
Step 1: The scale 1:100 implies that for every 100 units in the real world, the house represents 1 unit on the blueprint drawing. In other words, it implies that 100 units of an actual house is equal to 1 unit of a blueprint drawing.
Step 2: Now, we will calculate the actual dimensions of the master bedroom using scale 1:100. Here, the scale factor is 100, therefore, we will multiply the blueprint dimensions by 100.
Therefore,
Actual length of master bedroom = 6 100 = 600 units
Actual width of master bedroom = 4 100 = 400 units
Hope you have understood what scale is, and how ratio is used to write scale in Math. With this understanding, you can now easily draw the blueprints of the original design with precise measurements.
FAQs on How To Write Scale In Graph Step By Step Guide
1. What is scale in a graph?
The scale in a graph is the value that each division or unit on the axis represents. It shows how much quantity one square or tick mark stands for on the x-axis and y-axis.
- For example, if 1 cm on the graph paper represents 10 units, the scale is 1 cm = 10 units.
- The scale helps display large or small data clearly.
- A correct scale makes the graph accurate and easy to read.
2. How do you write the scale on a graph?
To write the scale of a graph, clearly state what one division on each axis represents. Follow these steps:
- Choose a suitable interval (like 1, 2, 5, 10, 50, etc.).
- Write it below or beside the graph as: Scale: 1 cm = 5 units (example).
- If x and y axes have different scales, mention both separately.
3. How do you choose a suitable scale for a graph?
A suitable scale is chosen by selecting equal intervals that cover the entire data range neatly. To choose the right scale:
- Find the minimum and maximum values in the data.
- Select intervals that are easy to multiply (1, 2, 5, 10, 20, 50…).
- Ensure the graph uses most of the available space.
4. Can the x-axis and y-axis have different scales?
Yes, the x-axis and y-axis can have different scales if the data ranges are different. For example:
- X-axis: 1 cm = 1 year
- Y-axis: 1 cm = 10 units
5. What is an example of writing scale in a graph?
An example of writing scale is: Scale: 1 cm = 5 students. Suppose the number of students is 5, 10, 15, and 20.
- Mark 0 at the origin.
- Each 1 cm division represents 5 students.
- 20 students will be plotted at the 4th division.
6. Why is scale important in a graph?
The scale is important in a graph because it ensures accurate representation and correct interpretation of data. Without a proper scale:
- The graph may look misleading.
- Values may appear exaggerated or minimized.
- Comparisons become inaccurate.
7. What happens if the scale is not uniform in a graph?
If the scale is not uniform, the graph can misrepresent the data and lead to wrong conclusions. A uniform scale means equal distances represent equal values.
- For example, if one gap represents 10 units and another represents 20 units without notice, the graph becomes incorrect.
- Always keep equal intervals consistent on each axis.
8. What is the difference between scale and interval in a graph?
The scale tells what one unit or division represents, while the interval is the gap between two consecutive marks on the axis. For example:
- If 1 cm = 10 units, then 10 units is the scale.
- The space between 0 and 10 is one interval.
9. How do you write scale when drawing a bar graph?
When drawing a bar graph, write the scale based on the highest value in the data set. Steps include:
- Identify the maximum value.
- Choose a convenient interval (like 5, 10, 50).
- Write below the graph: Scale: 1 division = 10 units.
10. What are common mistakes when writing scale in a graph?
Common mistakes when writing scale in a graph include choosing uneven intervals or not labeling the scale clearly. Avoid these errors:
- Using non-uniform spacing between numbers.
- Choosing very large or very small intervals unnecessarily.
- Forgetting to mention the scale statement.