


ICSE Class 10 Mathematics Chapter 24 Selina Concise Solutions - Free PDF Download
Exercise 24(A)
1. Find the mean of the following set of numbers:
(i) 6, 9, 11, 12 and 7
Ans:
(i) By definition of mean we can say that
Mean = ∑x/ n
Here n = 5
Thus now Mean = $\dfrac{~\left( 6~+~9~+~11~+~12~+~7 \right)}{5}$= 9
(ii) 11, 14, 23, 26, 10, 12, 18 and 6
Ans: The formula for mean is,
Mean = ∑x/ n
Here n = 8
Similar to 1 we have,
Thus now Mean = $\dfrac{\left( 11~+~14~+~23~+~26~+~10~+~12~+~18~+~6 \right)}{8}$= $\dfrac{120}{8}$=15
2. Marks obtained (in mathematics) by 9 students are given below:
60, 67, 52, 76, 50, 51, 74, 45 and 56
Find the arithmetic mean
Ans: It is given that in mathematics 9 students have obtained the following marks 60, 67, 52, 76, 50, 51, 74, 45 and 56.
Now by definition of Mean we have,
Mean = ∑x/ n
Here we know that n = 9
Thus,
Mean = $\dfrac{\left( 60~+~67~+~52~+~76~+~50~+~51~+~74~+~45~+~56 \right)}{9}$= 59
If marks of each student are increased by 4; what will the new value of the arithmetic mean?
Ans: To find the value of the arithmetic mean. If the marks of each student are increased by 4.
Now if the marks are increased by 4 then the new arithmetic mean is = 59+4 = 63
3. Find the mean of the natural numbers from 3 to 12.
Ans: We have to find the mean of the natural numbers from 3 to 12.
The natural numbers between 3 to 12 are 3, 4, 5, 6, 7, 8, 9, 10, 11 and 12.
Here n = 10
Mean = ∑x/ n
Mean = $\dfrac{\left( 3~+~4~+~5~+~6~+~7~+~8~+~9~+~10~+~11~+~12 \right)}{10}$= 7.5
4.
Find the mean of 7, 11, 6, 5, and 6
Ans: The formula of Mean = ∑x/ n
Now we have to find the mean of 7, 11, 6, 5, and 6
hence n = 5.
Mean = $\dfrac{\left( 7~+~11~+~6~+~5~+~6 \right)}{5}$= 7.
If each number given in (a) is diminished by 2, find the new value of mean.
Ans: Now if 2 is subtracted from each number, then the new mean will be 7 - 2 = 5.
5. If the mean of 6, 4, 7, ‘a’, and 10 is 8. Find the value of ‘a’
Ans: It is given that,
The number of terms (n) = 5
Mean value = 8
Sum of all the terms = 8 x 5 = 40 …… (i)
Sum of numbers = 6 + 4 + 7 + a + 10 = 27 + a ….. (ii)
Now equating (i) and (ii), we get
27 + a = 40
Hence, a = 13.
6. The mean of the numbers 6, ‘y’, 7, ‘x’, and 14 is 8. Express ‘y’ in terms of ‘x’.
Ans:
It is given that,
No. of terms (n) = 5 and mean = 8
Now sum of all the terms = 5 x 8 = 40 ……. (i)
Now sum of all the numbers = 6 + y + 7 + x + 14 = 27 + y + x ……. (ii)
Now let us just equate (i) and (ii), we get
27 + y + x = 40
x + y = 13
Hence, y = 13 – x
7. The ages of 40 students are given in the following table:
Find the arithmetic mean.
Ans:
Now the arithmetic mean by definition is,
Mean = $\dfrac{\sum fi~xi}{\sum fi}$= $\dfrac{614}{40~}$= 15.35
8. If 69.5 is the mean of 72, 70, x, 62, 50, 71, 90, 64, 58 and 82, find the value of x.
Ans: From the question, we can say that,
The number of terms = 10
Mean value = 69.5
∴ Sum of numbers = 69.5 $\times 10=695$….(i)
The sum of the given number = 72 + 70 + x + 62 + 50 + 71 + 90 + 64 + 58 + 82 = 619+x ….(ii)
Now let us equate (i) and (ii)
619 + x = 695
⇒ x = 695 – 619 = 76
9. The following table gives the heights of plants in centimeters. If the mean height of plants is 60.95 cm; find the value of ‘f’.
Ans:
Now Mean = 60.95
$\dfrac{1718+60f}{28+f}$= 60.95
$\Rightarrow ~$1718+60f = 60.95 (28+f)
$\Rightarrow $ 1718+ 60f = 1706.6 + 60.95f
$\Rightarrow $ 0.95f = 11.4
f = $\dfrac{11.4}{0.95}$= 12
10. From the data given below, calculate the mean wage, correct to the nearest Rupee.
(i) If the number of workers in each category is doubled, what would be the new mean wage?
Ans:
Now mean is given by,
$\underline{x~}$= $\dfrac{\sum fi~xi}{\sum fi}$= $\dfrac{3360}{42}$= 80
(i) The mean would remain the same even if the number of workers in each category is doubled.
Hence the mean would be 80.
(ii) If the wages per day in each category are increased by 60%, what is the new mean wage?
Ans: To find the new mean wage, if the wages per day in each category are increased by 60%
Now the mean will be increased by 60% if the wages per day per worker is increased by 60%
Therefore the New mean = 80 $\times \dfrac{160}{100}$= 128.
(iii) If the number of workers in each category is doubled and the wages per day per worker are reduced by 40%. What would be the new mean wage?
Ans: Even if the number of workers is doubled then there would be no change in the mean but if the wages per worker is reduced by 40%, then
Now new mean would be = 80 $\times \dfrac{60}{100}$ = 48
11. The contents of 100 matchboxes were checked to determine the number of matches they contained.
(i) Calculate, correct to one decimal place, the mean number of matches per box.
Ans:
(i) We have to calculate correctly to one decimal place, the mean number of matches per box.
Mean is given by, $\underline{x~}$= $\dfrac{\sum fi~xi}{\sum fi}$= $\dfrac{3813}{100}$= 38.13 = 38.1
(ii) Determine how many extra matches would have to be added to the total contents of the 100 boxes to bring the mean up to exactly 39 matches.
Ans: Now in the second case the new mean = 39 matches
∴ Total contents = 39 x 100 = 3900
But we know that the number of matches = 3813
∴ Number of new matches to be added = 3900 – 3813 = 87
12. If the mean of the following distribution is 3, find the value of p.
Ans:
It is given that mean = 3
The mean by the formula is given by,
$\underline{x~}$= $\dfrac{\sum fi~xi}{\sum fi}$
3 = $\dfrac{6p+87}{33}$
6p= 12
$\Rightarrow $p = 2
13. In the following table, Σf= 200 and mean = 73. Find the missing frequencies f1 and f2.
Ans: Now we have,
It is given that ∑f= 200
86+f1+f2 = 200
F1+f2 =114 ……(1)
Now mean is given by , $\underline{x~}$= $\dfrac{\sum fi~xi}{\sum fi}$
73 = $\dfrac{~7000~+~50f1~+100f2}{200}$
$\Rightarrow $f1+2f2 =152 …..(2)
Subtract (2) from (1) we get,
f2= 38
Now , f1 = 114 -38=76
Hence, f1 = 114 and f2 = 38
14. Find the arithmetic mean (correct to the nearest whole number) by using the step-deviation method.
Ans:
Now we know that Mean formula= A + $\dfrac{\sum ft}{\sum fi}\times i$
= $\dfrac{30+\left( 598 \right)5}{384}$
= 30 - 7.79 = 22.21= 22 approximately.
15. Find the mean (correct to one place of the decimal) by using the short-cut method.
Ans:
Now let us assume that the mean value is A =45.
Now mean = A + $\dfrac{\sum fd}{\sum f}$
= 45 + $\dfrac{\left( -88 \right)}{200}$= 45 - 0.44
= 44.56
Exercise 24(B)
1. The following table gives the ages of 50 students in a class. Find the arithmetic mean of their ages.
Ans:
By formula we know that arithmetic mean is given by,
$\underline{x~}$= $\dfrac{\sum fi~xi}{\sum fi}$= $\dfrac{1074}{50}$= 21.48
2. The following table gives the weekly wages of workers in a factory.
Calculate the mean by using:
(i) Direct Method
Ans: Mean by the direct method
By formula we know that arithmetic mean is given by,
$\underline{x~}$= $\dfrac{\sum fi~xi}{\sum fi}$= $\dfrac{5520}{80}$
(ii) Short – Cut Method
Ans: Finding meaning by short-cut method.
Here we know that A = 72.5
Now by formula we know that mean is given by,
$\underline{x~}$=A+ $\dfrac{\sum fi~di}{\sum fi}$= 72.5+($\dfrac{-280}{80}$) = 72.5 - 3.5 = 69.
3. The following are the marks obtained by 70 boys in a class test:
Calculate the mean by:
(i) Short – cut method
Ans:
Finding the mean by,
(i) Short–Cut Method
Now we know that, A = 65
Now by formula, we know that mean is given by,
$\underline{x~}$=A+ $\dfrac{\sum fi~di}{\sum fi}$= 65 + ($\dfrac{-270}{70}$) = 65 - 3.86 =61.14.
(ii) Step – Deviation Method
Ans: Step – deviation method
Now we know that, A = 65
Now by formula, we know that mean is given by,
$\underline{x~}$=A+h $\times $ $\dfrac{\sum fi~ui}{\sum fi}$= 65 + 10 $\times $($\dfrac{-27}{70}$) = 65 - 3.86 =61.14.
4. Find mean by step – deviation method:
Ans: Now we have to find the mean by using the step-division method.
Here we know that A = 87.50 and h = 7
Now by formula, we know that mean is given by,
$\underline{x~}$=A+h $\times $ $\dfrac{\sum fi~ui}{\sum fi}$= 87.5+7$\times \dfrac{29}{150}$= 87.5 $\times 1.35=88.85$
5. The mean of the following frequency distribution is 21 $\dfrac{1}{7}$ Find the value of ‘f
Ans:
It is given that $\underline{x~}$= 21 $\dfrac{1}{7}$= $\dfrac{148}{7}$
By formula we know that arithmetic mean is given by,
$\underline{x~}$= $\dfrac{\sum fi~xi}{\sum fi}$= $\dfrac{1235+35f}{63+f}$
$\Rightarrow \dfrac{148}{7}$=$\dfrac{1235+35f}{63+f}$
$\Rightarrow 9324~+148f~=8645+245f$
$\Rightarrow f=~\dfrac{679}{97}$= 7
6. Using the step-deviation method, calculate the mean marks of the following distribution.
Ans: Let the assumed mean be 72.5
By formula we know that arithmetic mean is given by,
$\underline{x~}$=A+ $\dfrac{\sum fi~di}{\sum fi}$= 72.5 + $\dfrac{-280}{80}$= 72.5 -3.5 =69.
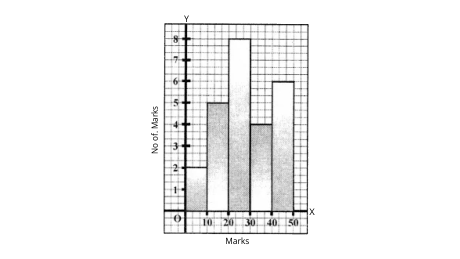
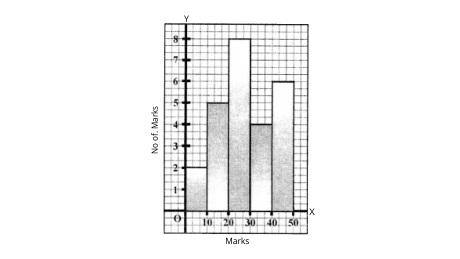
7. Using the information given in the adjoining histogram; calculate the mean.
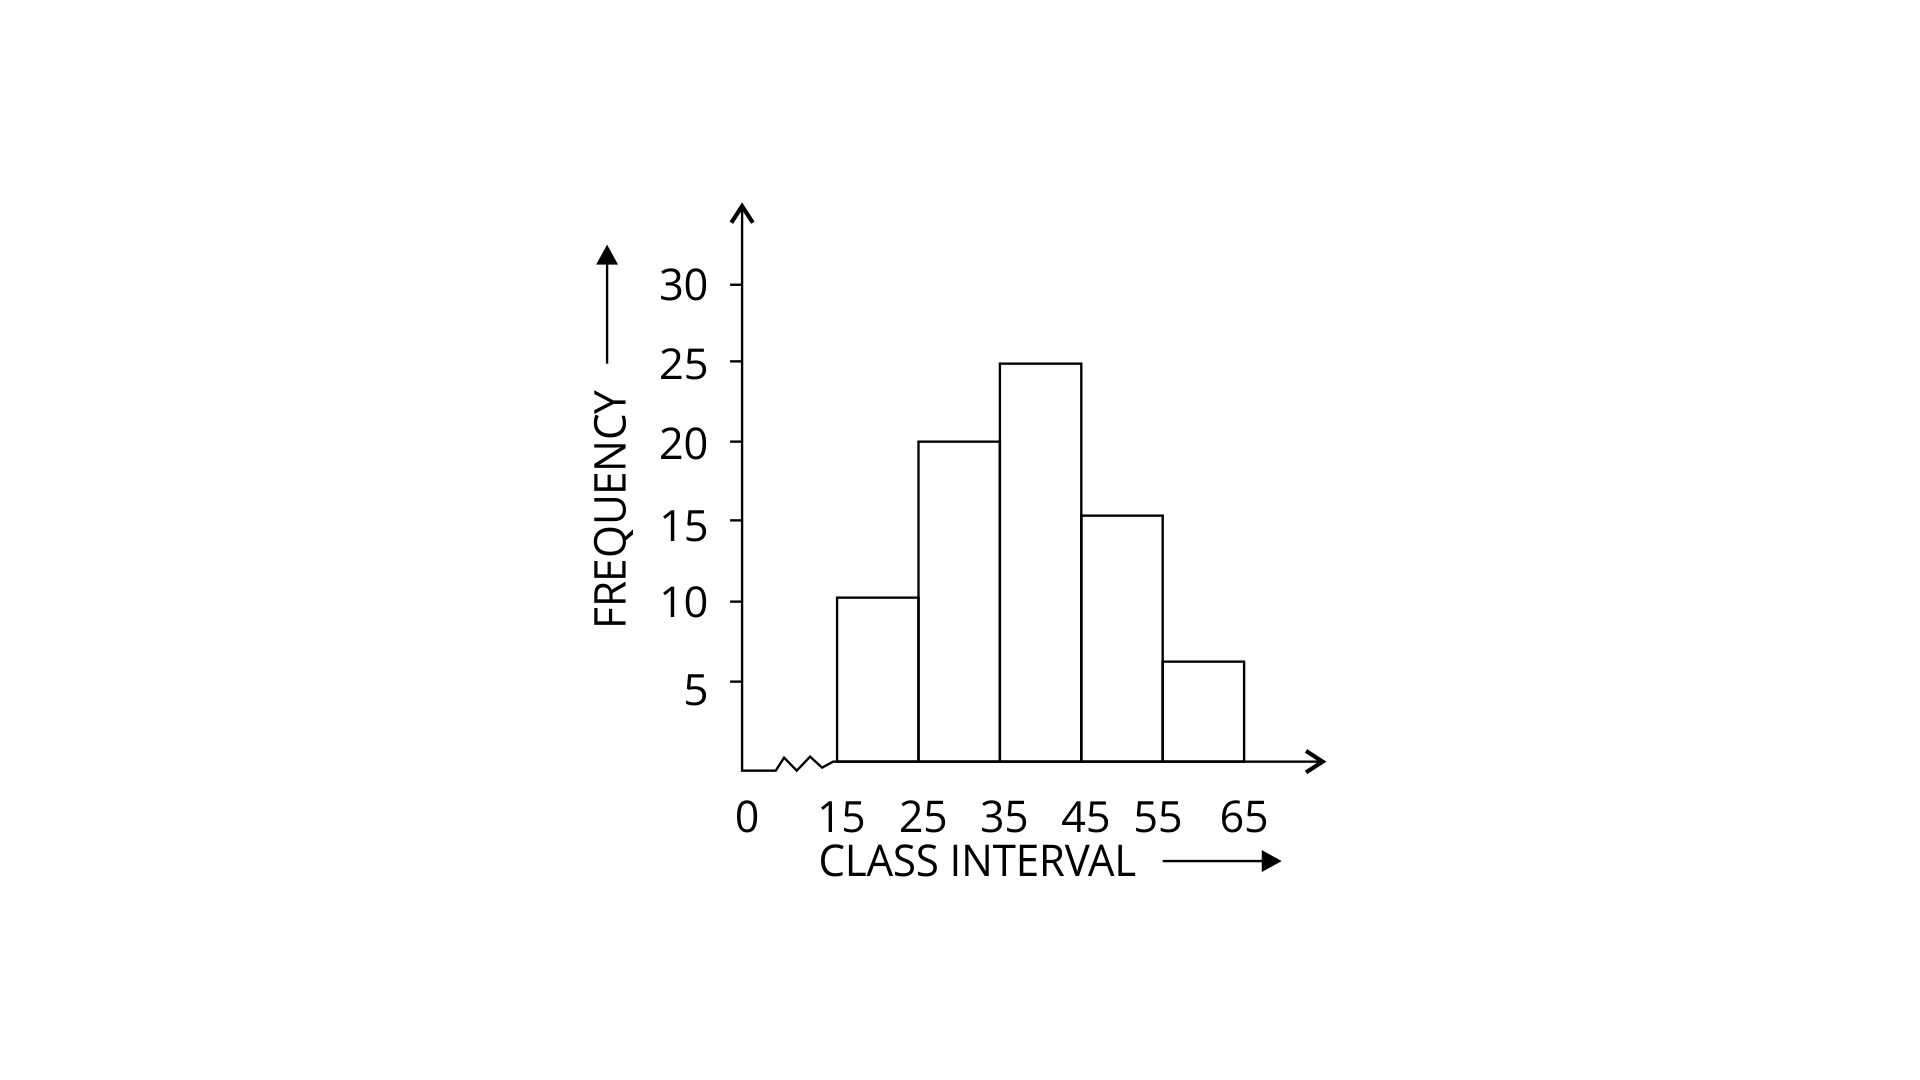
Ans:
By formula we know that arithmetic mean is given by,
$\underline{x~}$=$\dfrac{\sum fx}{\sum f}$=$\dfrac{2850}{75}$= 38
8. If the mean of the following observations is 54, find the value of p.
Ans:
It is given that the mean is 54.
By formula we know that arithmetic mean is given by,
$\underline{x~}$=$\dfrac{\sum fixi}{\sum fi}$
54 = $\dfrac{2370+30p}{39+p}$
⇒ 2106 + 54p = 2370 + 30p
⇒ 54p – 30p = 2370 – 2106
⇒ 24p = 264
p = $\dfrac{264}{24}$=11
Hence p =11
9. The mean of the following distribution is 62.8 and the sum of all the frequencies is 50. Find the missing frequencies f1 and f2.
Ans: It is given that mean = 62.8 and the sum of frequencies = 50
Now sum of frequencies = 50
30 +${{f}_{1}}+{{f}_{2}}=50~$
${{f}_{1}}+{{f}_{2}}=50~$-30 =20 …. (1)
Mean = $\underline{x~}$=$\dfrac{\sum fixi}{\sum fi}$
62.8 = $\dfrac{2060+30{{f}_{1}}+70{{f}_{2}}}{50}$
$\Rightarrow $2060+30${{f}_{1}}+70{{f}_{2}}$=3140
$\Rightarrow $30${{f}_{1}}+70{{f}_{2}}$=3140-2060
$\Rightarrow $3${{f}_{1}}+7{{f}_{2}}$=108……(2)
Now multiplying (1) by 7 and (2) by 1 we have,
7${{f}_{1}}+7{{f}_{2}}=140$
3${{f}_{1}}+7{{f}_{2}}=108$
Subtracting (1) and (2) we have,
4${{f}_{1}}=32$
${{f}_{1}}=~8$
But ${{f}_{1}}+{{f}_{2}}=20$
Now ${{f}_{2}}=12$
Hence ${{f}_{1}}=~8$and ${{f}_{2}}=12$
10. Calculate the mean of the distribution given below using the shortcut method.
Ans:
A =45.5
Mean =A+$\dfrac{\sum fiui}{\sum fi}\times 10$
= 45.5 + $\dfrac{7}{50}\times 10$
= 45.5 +1.4 = 46.9.
Exercise 24(C)
1.A student got the following marks in 9 questions of a question paper.
3, 5, 7, 3, 8, 0, 1, 4 and 6.
Find the median of these marks.
Ans: Now the first step is to arrange the given data in the descending order,
8, 7, 6, 5, 4, 3, 3, 1, 0
We have to find the median from the given numbers and hence the middle term is 4 which is nothing but the 5th term and hence the median = 4
2. The weights (in kg) of 10 students of a class are given below:
21, 28.5, 20.5, 24, 25.5, 22, 27.5, 28, 21 and 24.
Find the median of their weights.
Ans: Now the first step is to start arranging the given data in the descending order, which would be.
28.5, 28, 27.5, 25.5, 24, 24, 22, 21, 21, 20.5
After arranging the numbers the middle terms are 24 and 24 which are nothing but the 5th and 6th terms.
Thus now the median = $\dfrac{\left( 24+24 \right)}{2}$= 24
3. The marks obtained by 19 students of a class are given below:
27, 36, 22, 31, 25, 26, 33, 24, 37, 32, 29, 28, 36, 35, 27, 26, 32, 35 and 28.
Find median
Ans: It is given that the marks obtained by 19 students of a class are 27, 36, 22, 31, 25, 26, 33, 24, 37, 32, 29, 28, 36, 35, 27, 26, 32, 35 and 28.
Now the first step is to arrange the numbers in ascending order.
22, 24, 25, 26, 26, 27, 27, 28, 28, 29, 21, 32, 32, 33, 35, 35, 36, 36, 37
To Find the Median.
The middle term is the 10th term which is 29.
Hence the median = 29.
Find Lower Quartile
Ans: Lower quartile
As the number of students is 19, hence n = 19.
${{q}_{1}}$= $\dfrac{n+1th}{4}$term
${{q}_{1}}$= $\dfrac{19+1th}{4}$term
${{q}_{1}}$= 5th term.
Find Upper Quartile
Ans: Upper quartile
${{q}_{3}}={{\left[ \dfrac{3\left( n+1 \right)}{4} \right]}^{th}}$term
${{q}_{3}}={{\left[ \dfrac{3\left( 19+1 \right)}{4} \right]}^{th}}$term
${{q}_{3}}={{15}^{th~}}term~=~35~$
Find Interquartile Range
Ans: Interquartile range is given by =${{q}_{3}}$ -${{q}_{1}}$= 35 -26 = 9
4. From the following data, find:
Median
25, 10, 40, 88, 45, 60, 77, 36, 18, 95, 56, 65, 7, 0, 38 and 83
Ans: The first step is to arrange the given numbers in ascending order, so on we have.
0, 7, 10, 18, 25, 36, 38, 40, 45, 56, 60, 65, 77, 83, 88, 95
To Find the Median
The median is the mean of the 8th and the 9th term.
Thus now the median would be = $\dfrac{\left( 40+45 \right)}{2}$= $\dfrac{85}{2}$= 42.5.
Find Upper Quartile
Ans: Upper quartile is given by,
${{q}_{3}}={{\left[ \dfrac{3\left( n+1 \right)}{4} \right]}^{th}}$term
${{q}_{3}}$= terms = ${{12}^{th~}}$term = 65.
Find Interquartile Range
Ans: Interquartile range is given by = ${{q}_{3}}$ -${{q}_{1}}$
As the number of terms is 16, hence n =16.
Lower quartile ${{q}_{1}}$= $\dfrac{n~}{4}$th term = $\dfrac{16~}{4}$= 4th term = 18.
∴ ${{q}_{1}}$= 18
Interquartile range = ${{q}_{3}}$ -${{q}_{1}}$ = 65-18=47
5. The ages of 37 students in a class are given in the following table:
Ans:
From the question, we know that the number of terms (n) = 37
Median = $\dfrac{37+1th}{2}$term = 19th term
The 19th term is 14,
Therefore the median = 14
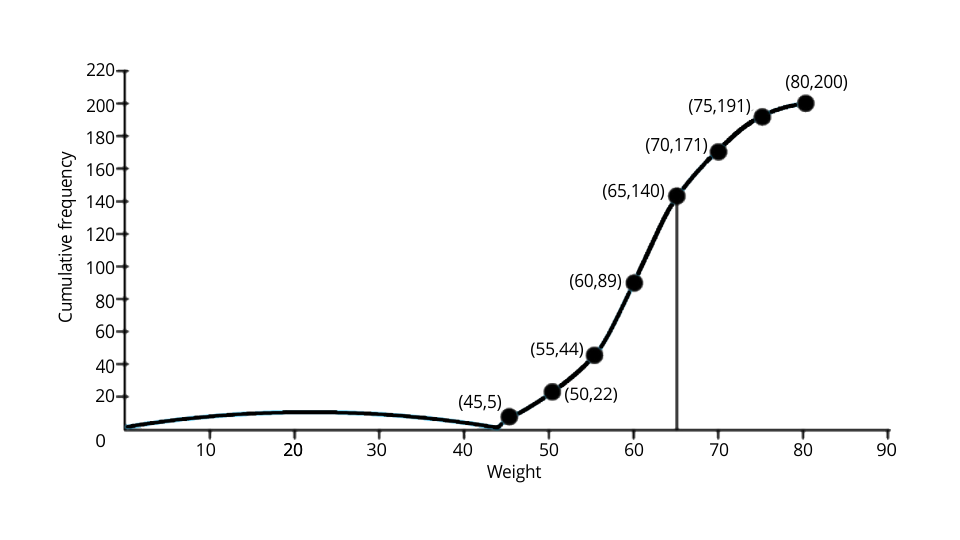
6. The weight of 60 boys are given in the following distribution table :
Find : (i) Median
Ans:
It is given that the number of terms = 60
Median:
The mean of the 30th and the 31st term is the median.
∴ Median = $\dfrac{39+39}{2}$= 39
Find Lower Quartile
Ans: Lower quartile ${{q}_{1}}$is given by = $\dfrac{1\times n}{4}$th term
= $\dfrac{1\times 60~th~}{4}$term, as n = 60
${{q}_{1}}$= 15th term = 38.
Find Upper Quartile
Ans: Upper quartile (${{q}_{3}}$)= $\dfrac{3n}{4}$th term
= $\dfrac{3}{4}\times 60=~45th~term=~40~$
Find Interquartile Range
Ans: Interquartile range is given by = ${{q}_{3}}$- ${{q}_{1}}$ = 40- 38= 2
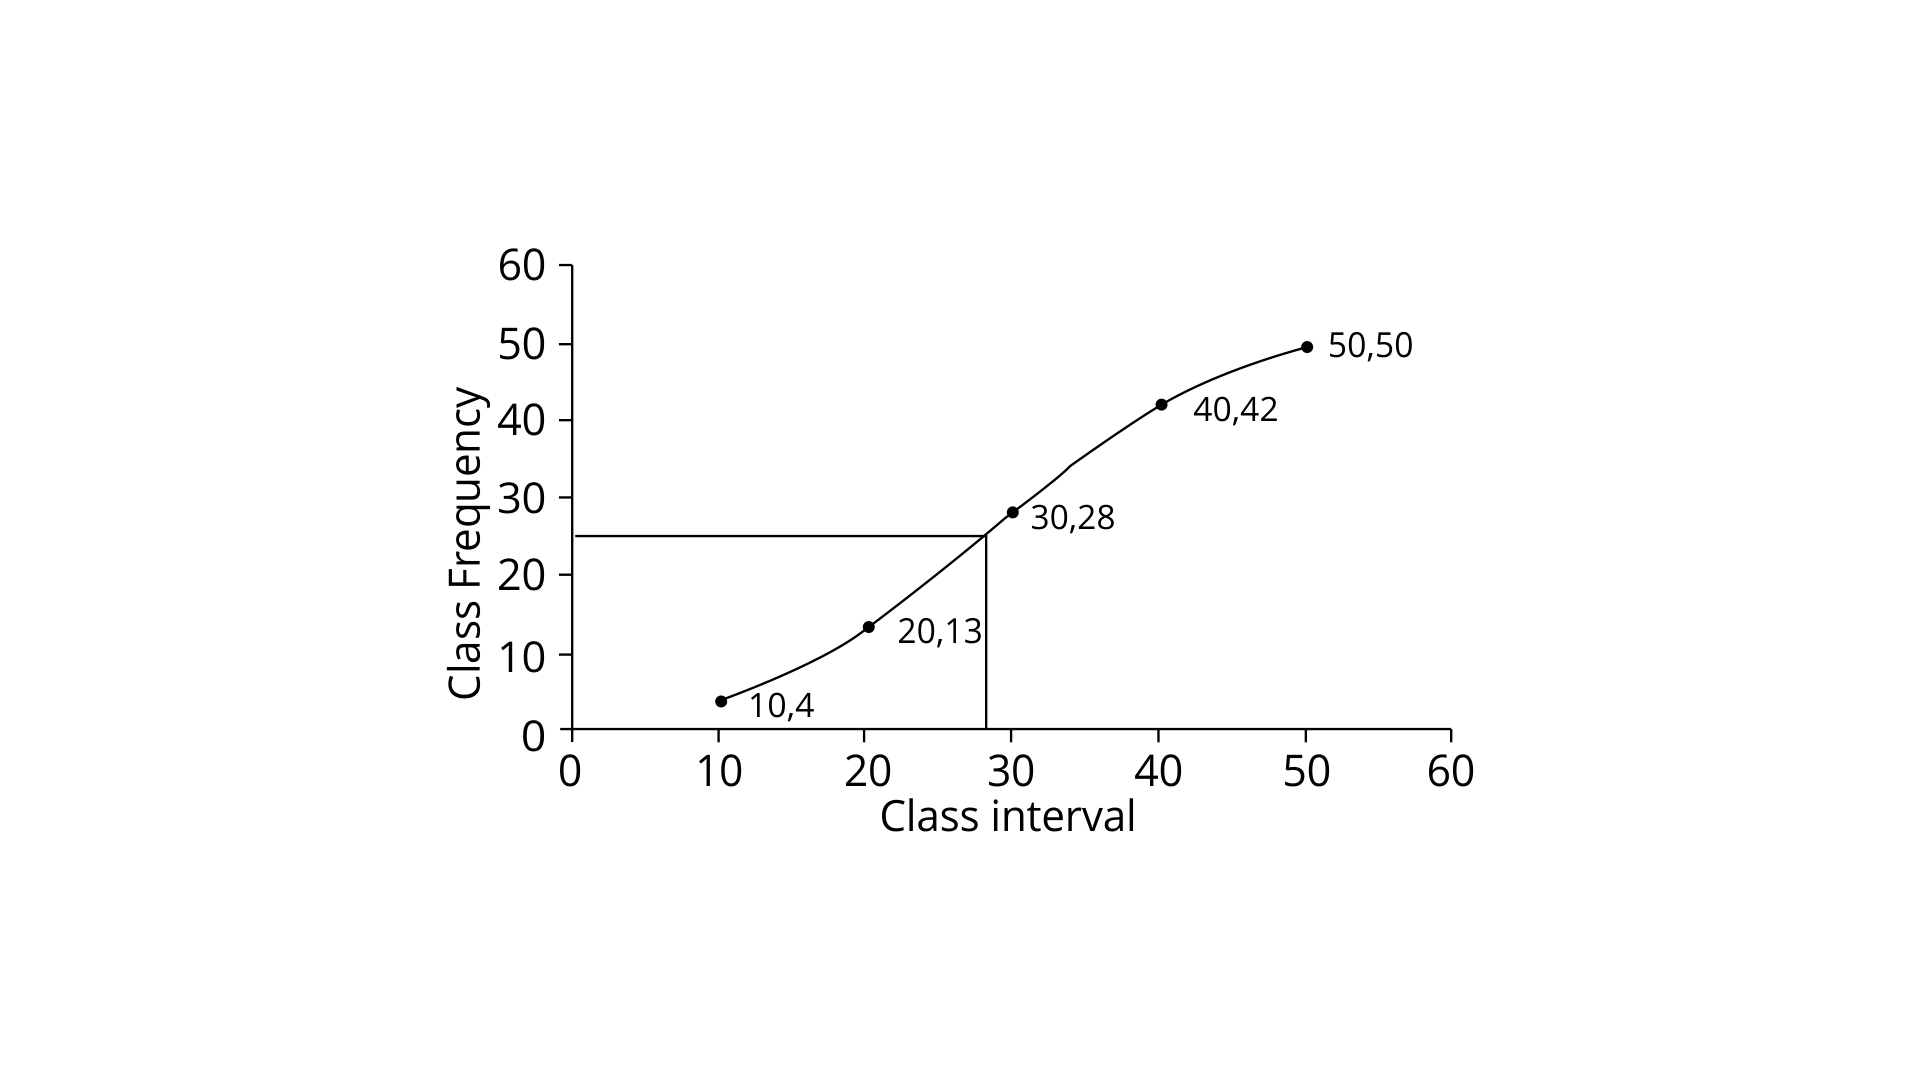
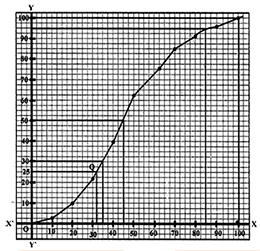
7. Estimate the median for the given data by drawing ogive :
Ans:
Number of terms = 50
∴ Median = $\dfrac{25th~+26th~}{2}$= 25.5 = 25.5 th term.
Now through the mark of 25.5 on the y-axis, draw a line which is parallel to x-axi which then meets the curve at A. Now from A dra a perpendicular to x-axis at B.
Therefore the value of B is the median which is 28.
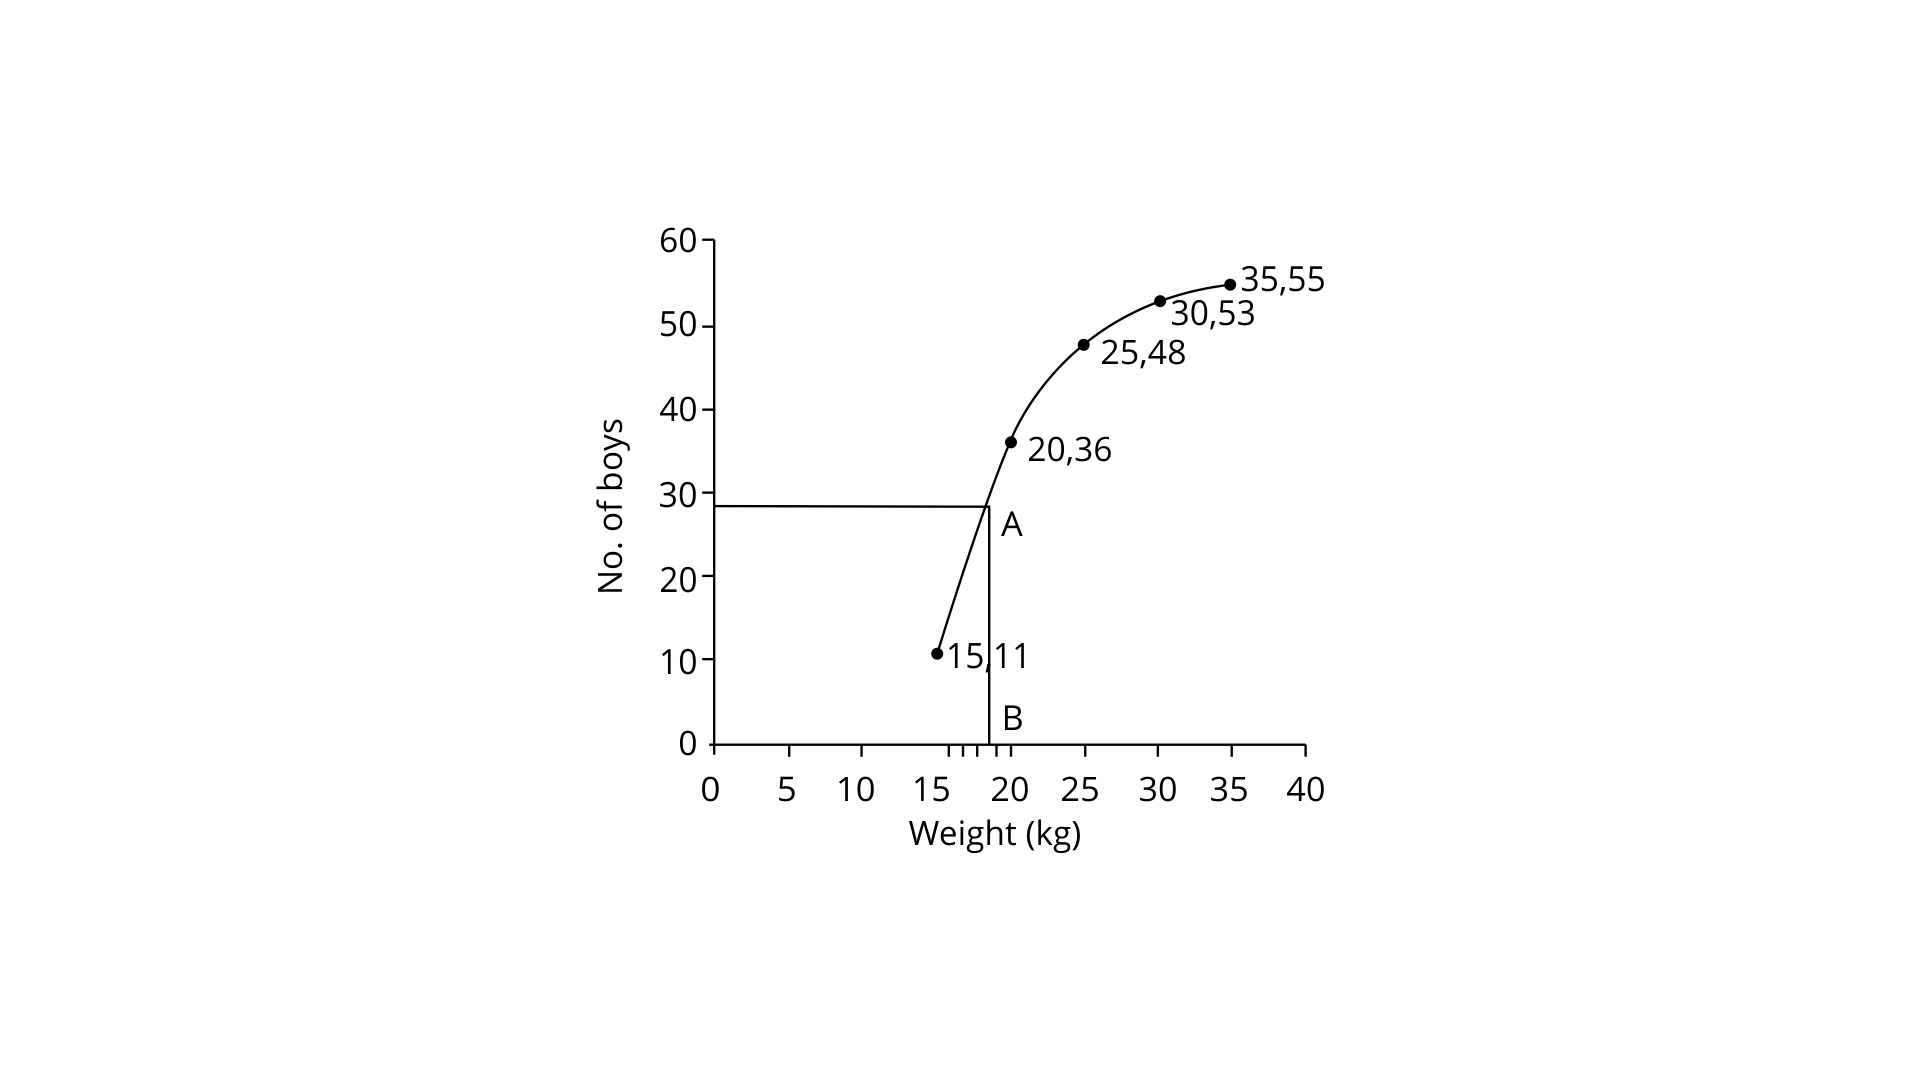
8. By drawing an ogive; estimate the median for the following frequency distribution :
Ans:
Number of terms = 55
∴ Median = $\dfrac{55+1}{2}$=28th term
Draw a line parallel to the x-axis that meets the curve at A through the 28th mark on the y-axis. Draw a perpendicular line segment from A to the x-axis. Which it meets at B.
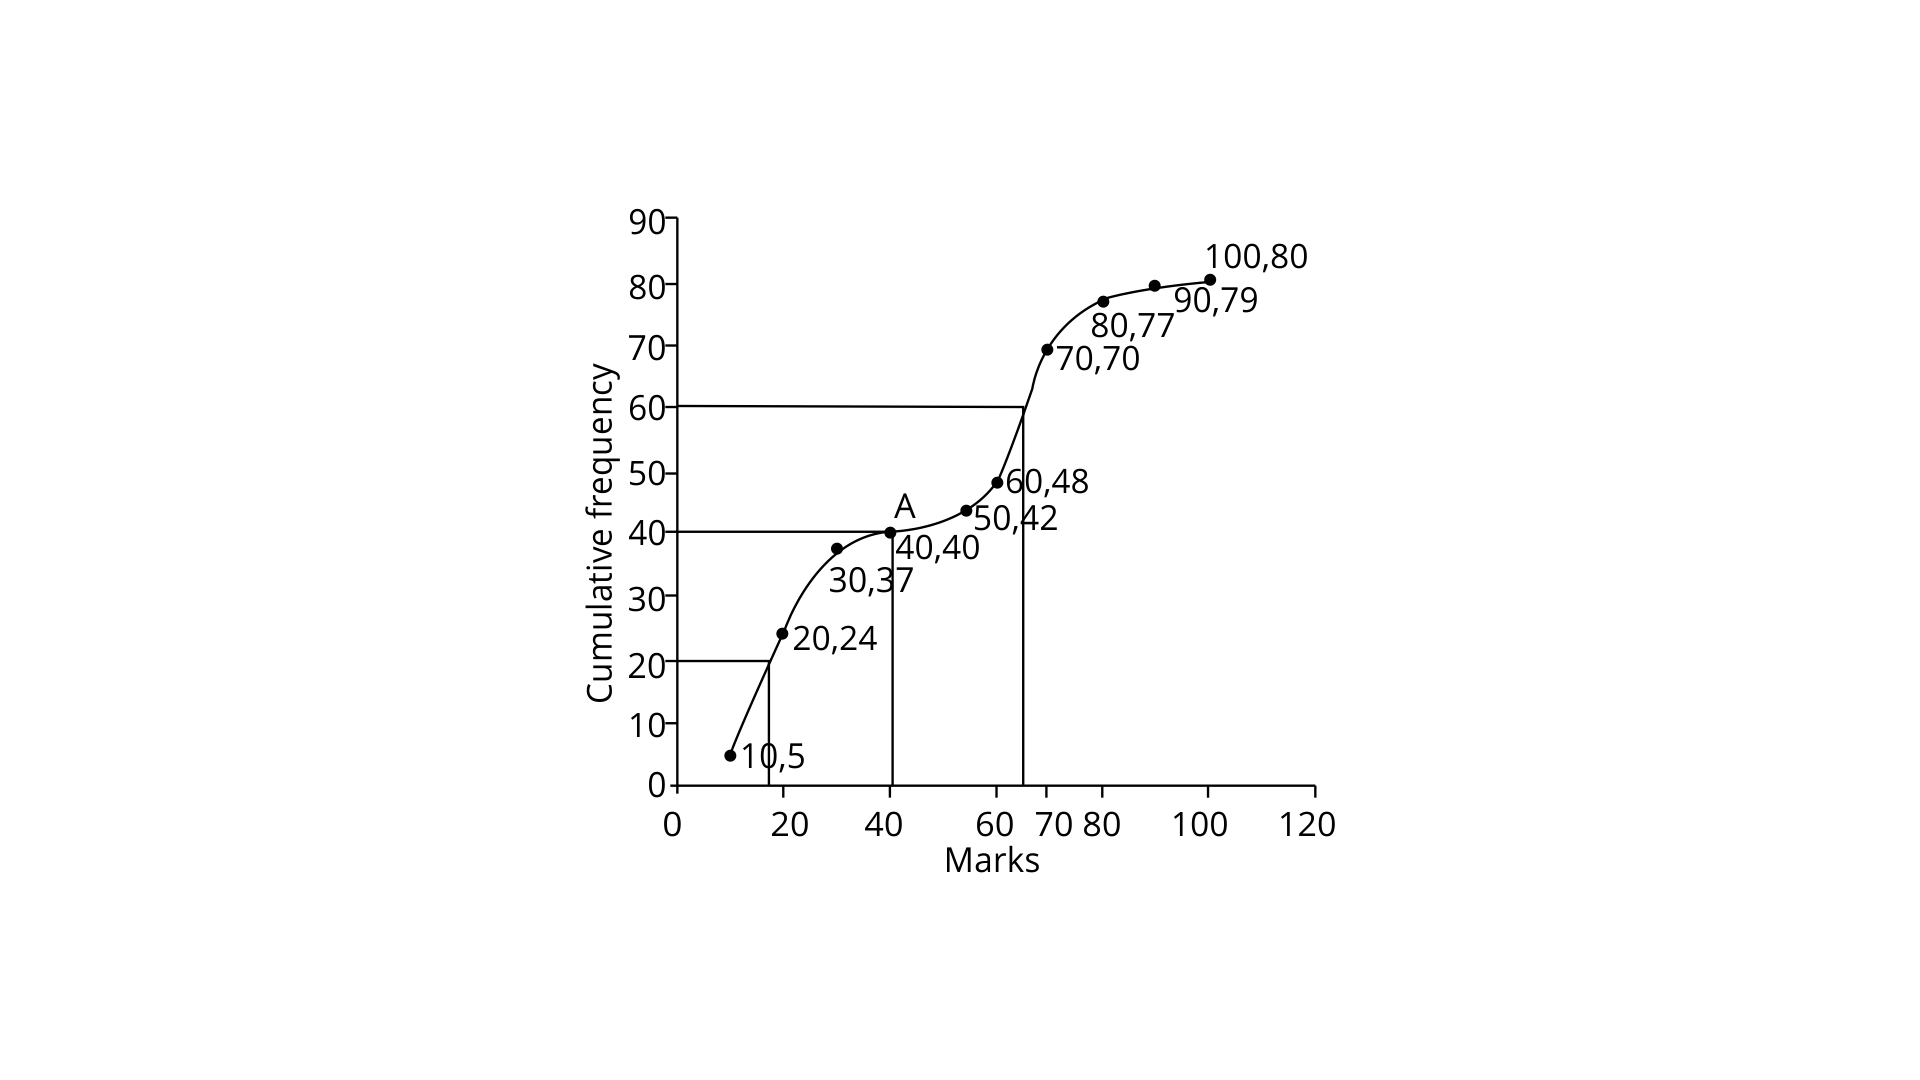
9. From the following cumulative frequency table, draw ogive and then use it to find :
(i) Median
Ans:
From the tabular column we can figure out that the number of terms = 80
(i) Median = Now through the 40th term mark draw a line which is parallel to the x-axis which then meets the curve at A.Now from A draw a perpendicular to x-axis which meets it at B.
Hence the value of B is the median = 40.
(ii) Find Lower Quartile.
Ans: Lower quartile(${{q}_{1}}$)= $\dfrac{n}{4}$th term.= 80th/4 = 20th term
The 20th term is 18.
(iii) Find Upper Quartile
Ans: Upper quartile(${{q}_{3}}$) = $\dfrac{3}{4}\times nth~term~$= $\dfrac{3\times 80}{4}$= 60th term = 66
10.In a school 100 pupils have heights as tabulated below:
Find the median height by drawing an ogive.
Ans:
From the question we can say that the number of terms are 100
Therefore median = n/2 = $\dfrac{100}{2}$ = 50th term
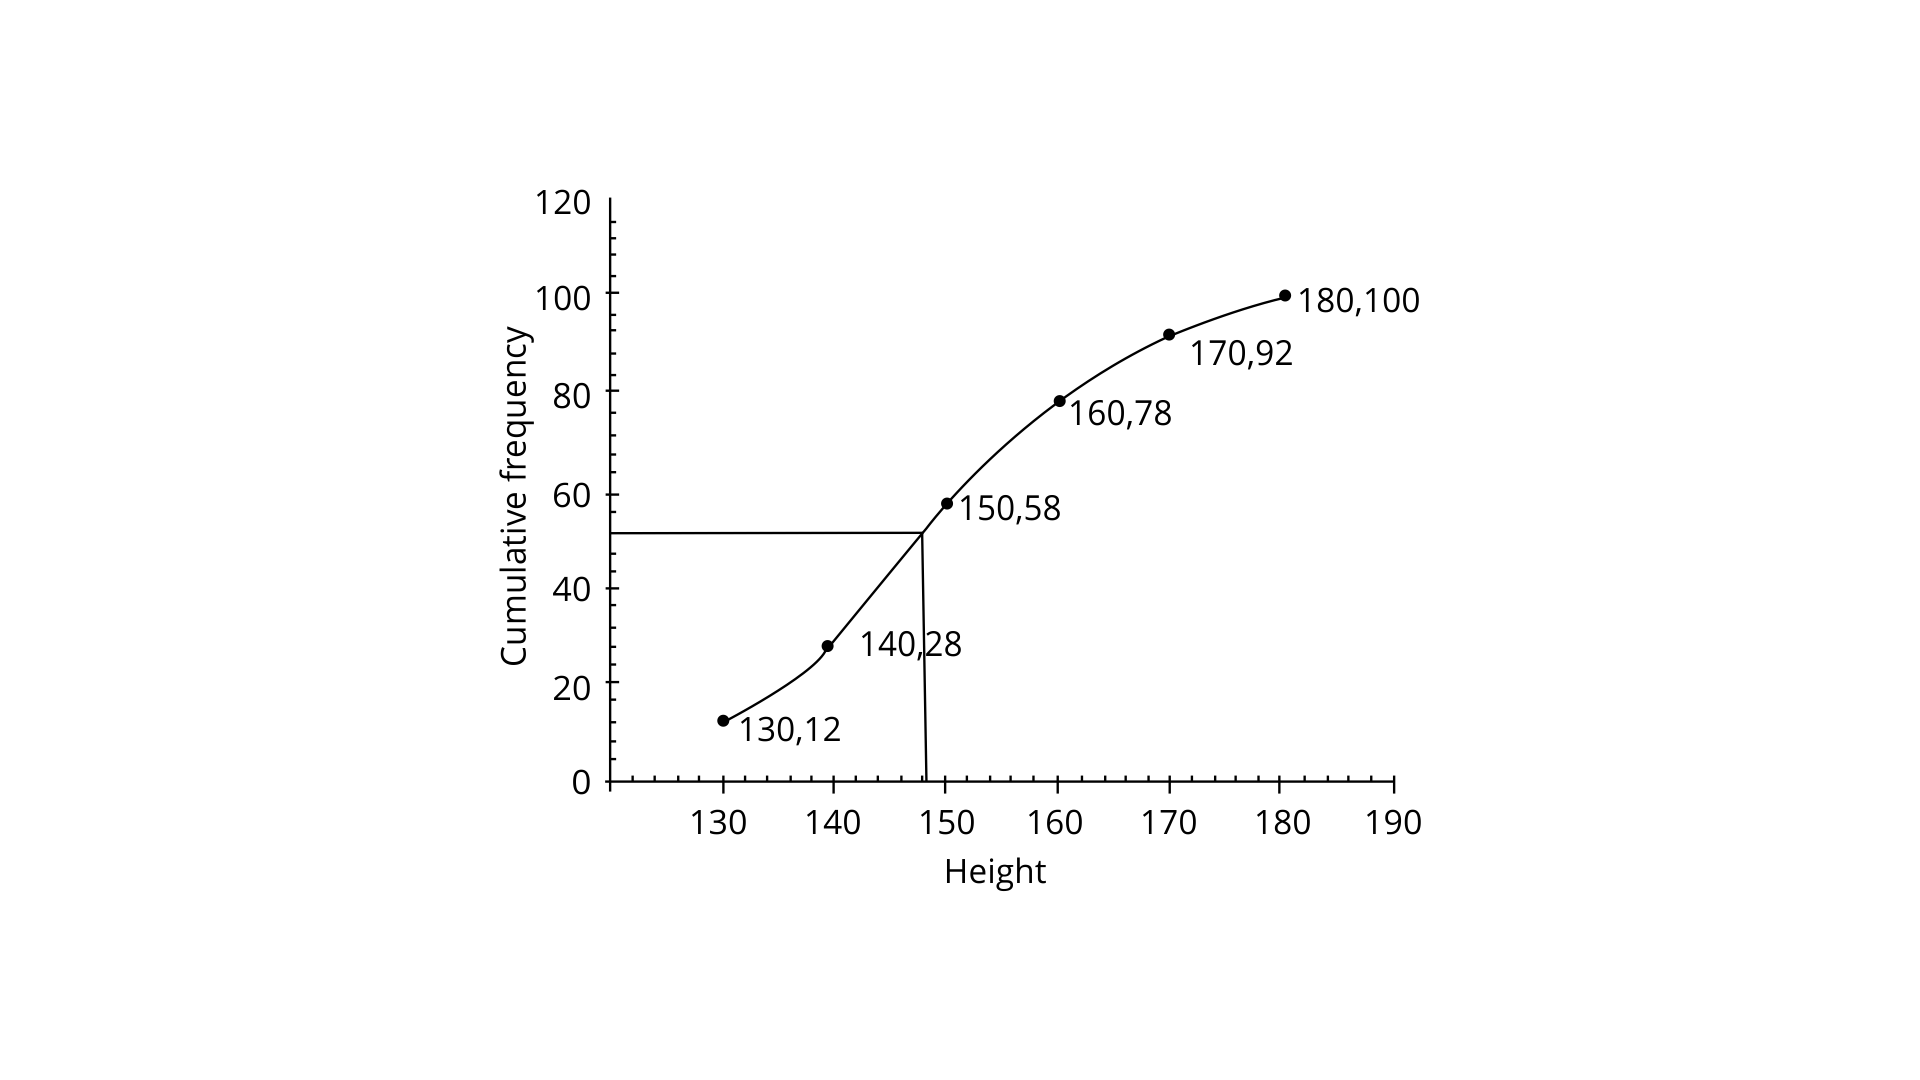
Now through the mark 50, draw a line that is parallel to the x-axis which then meets the curve at A. Now from A draw, a perpendicular to the x-axis which then meets the x-axis at B is the median which is nothing but 148 cm.
Exercise 24 (D)
1. Find the mode of the following data:
(i) 7, 9, 8, 7, 7, 6, 8, 10, 7 and 6
Ans: We have to find the mode for the given sequence of numbers
(i) 7, 9, 8, 7, 7, 6, 8, 10, 7 and 6
It is seen that 7 occurs 4 times i the given data
Hence we could say that mode = 7.
(ii) 9, 11, 8, 11, 16, 9, 11, 5, 3, 11, 17 and 8
Ans: 9, 11, 8, 11, 16, 9, 11, 5, 3, 11, 17 and 8
As we could figure out that 11 occurs 4 times in the given data.
We can say that mode =11.
2. The following table shows the frequency distribution of heights of 50 boys:
Find the mode of heights.
Ans: From definition we can say that mode is the value that appears most often in a set of data values. From the given data given to us we could say that mode is 122 cm as it has occurred most number of times which is that its frequency is 18
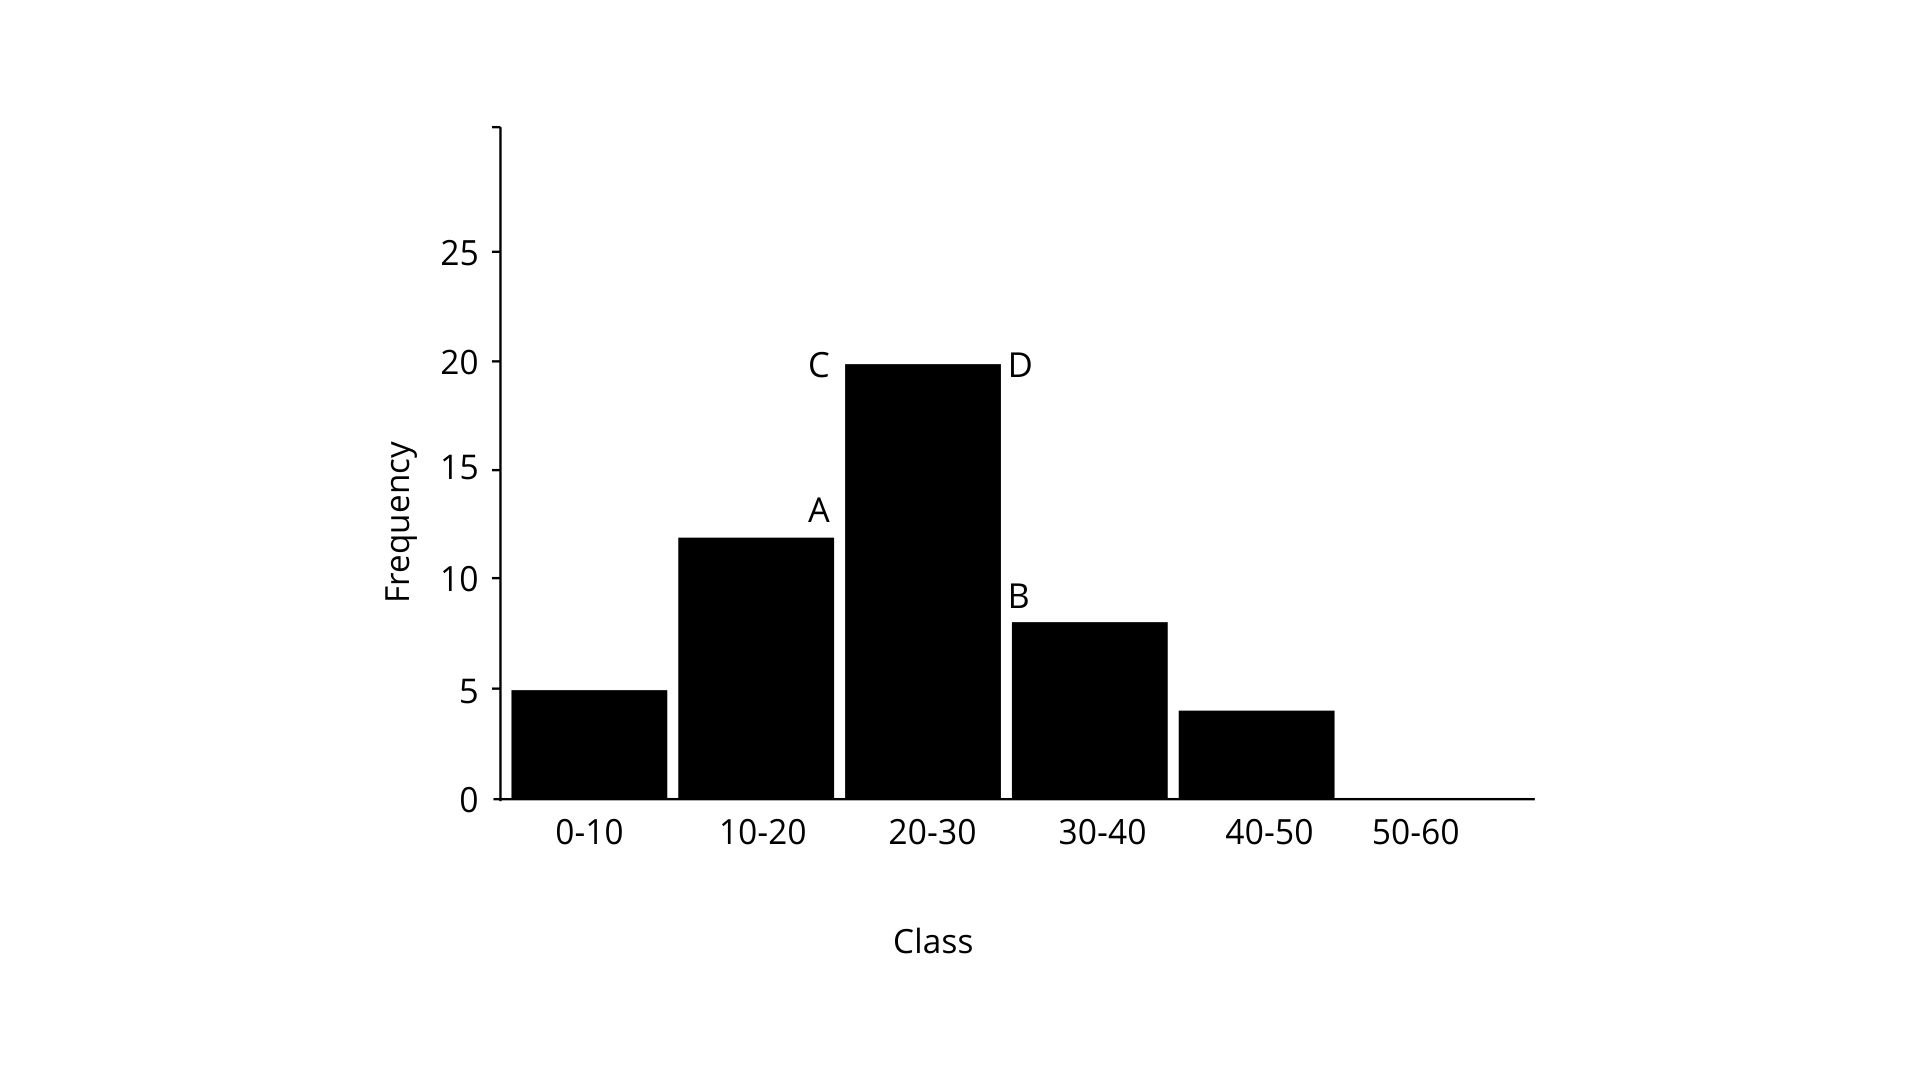
3. Find the mode of following data, using a histogram:
Ans: First let us sketch a histogram,
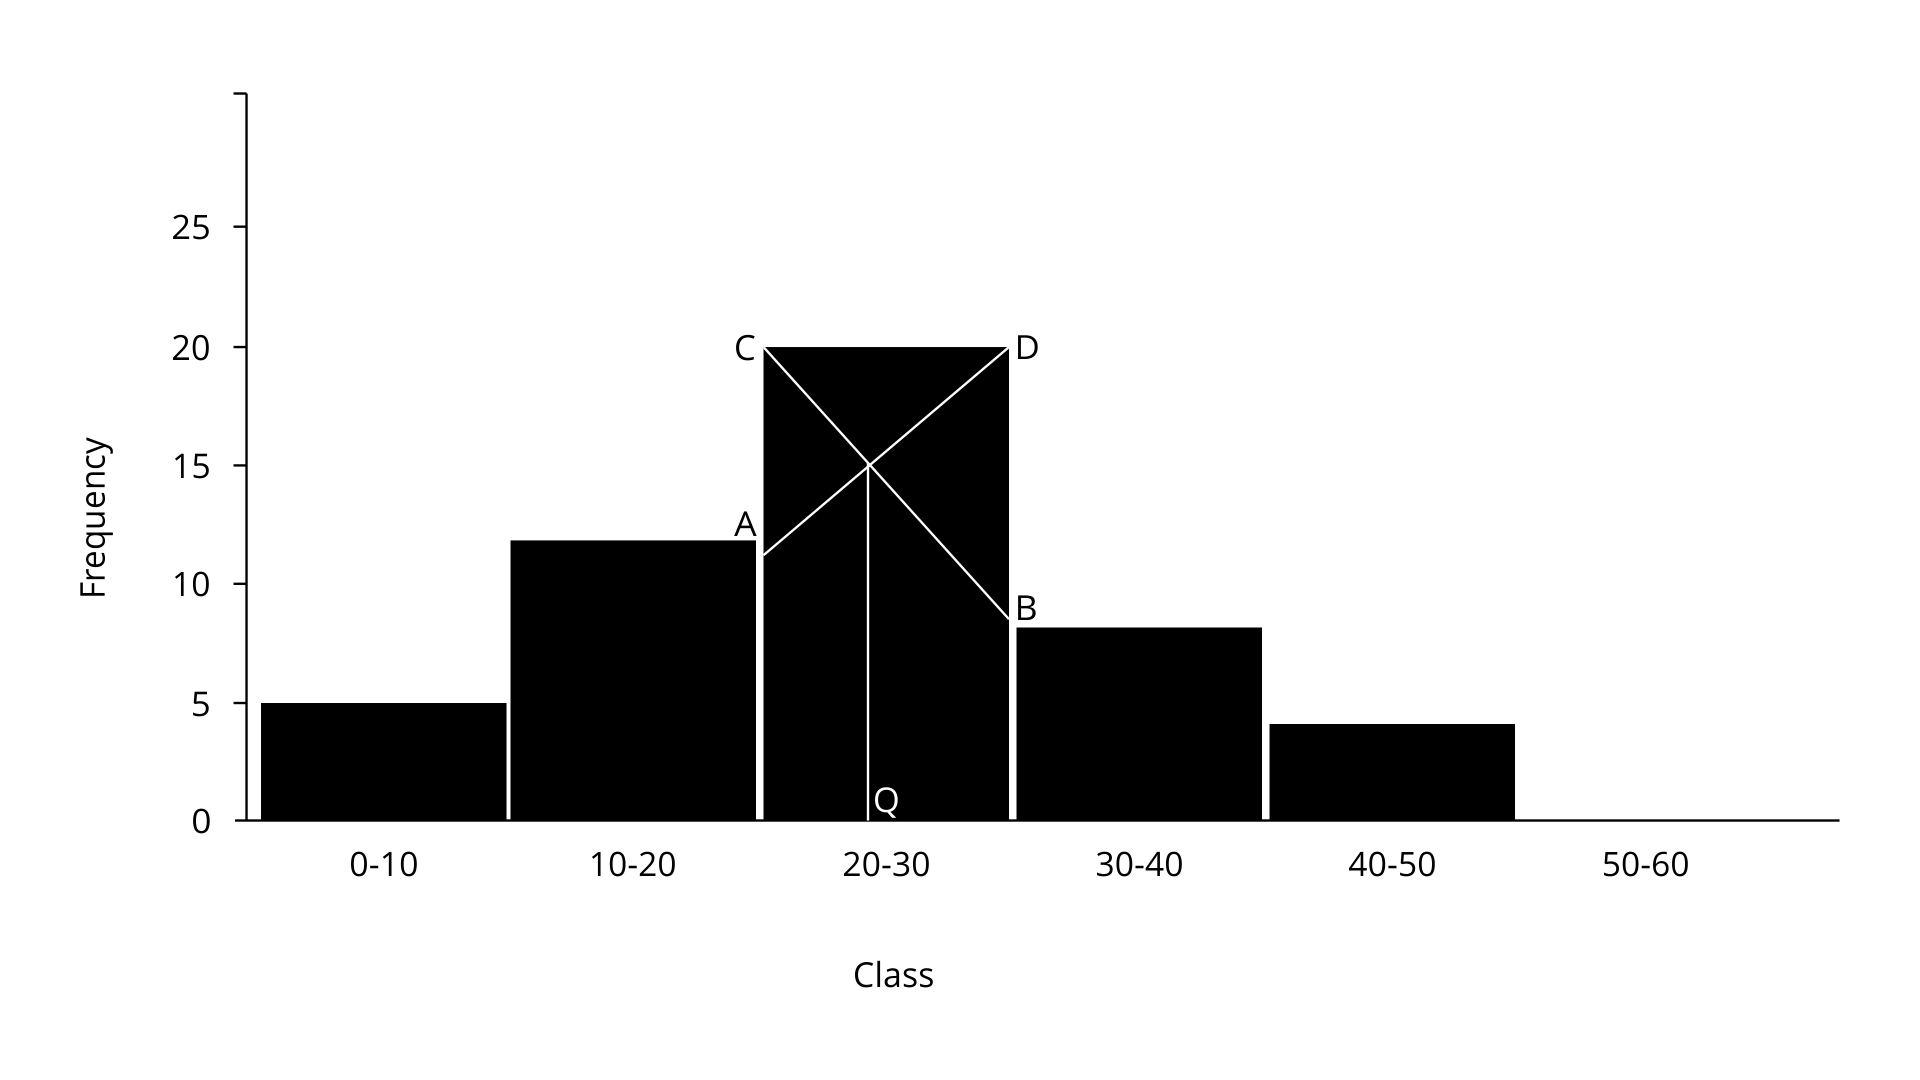
The intersection of lines AD and CB at P can be seen in the histogram. Draw a Q parallel to the horizontal x-axis. Clearly it is evident from the histogram we could say that mode is in 20-30, because in that class there are 20 frequencies.
4. The following table shows the expenditure of 60 boys on books. Find the mode of their expenditure:
Ans: The first step is to sketch a histogram from the given table provided.
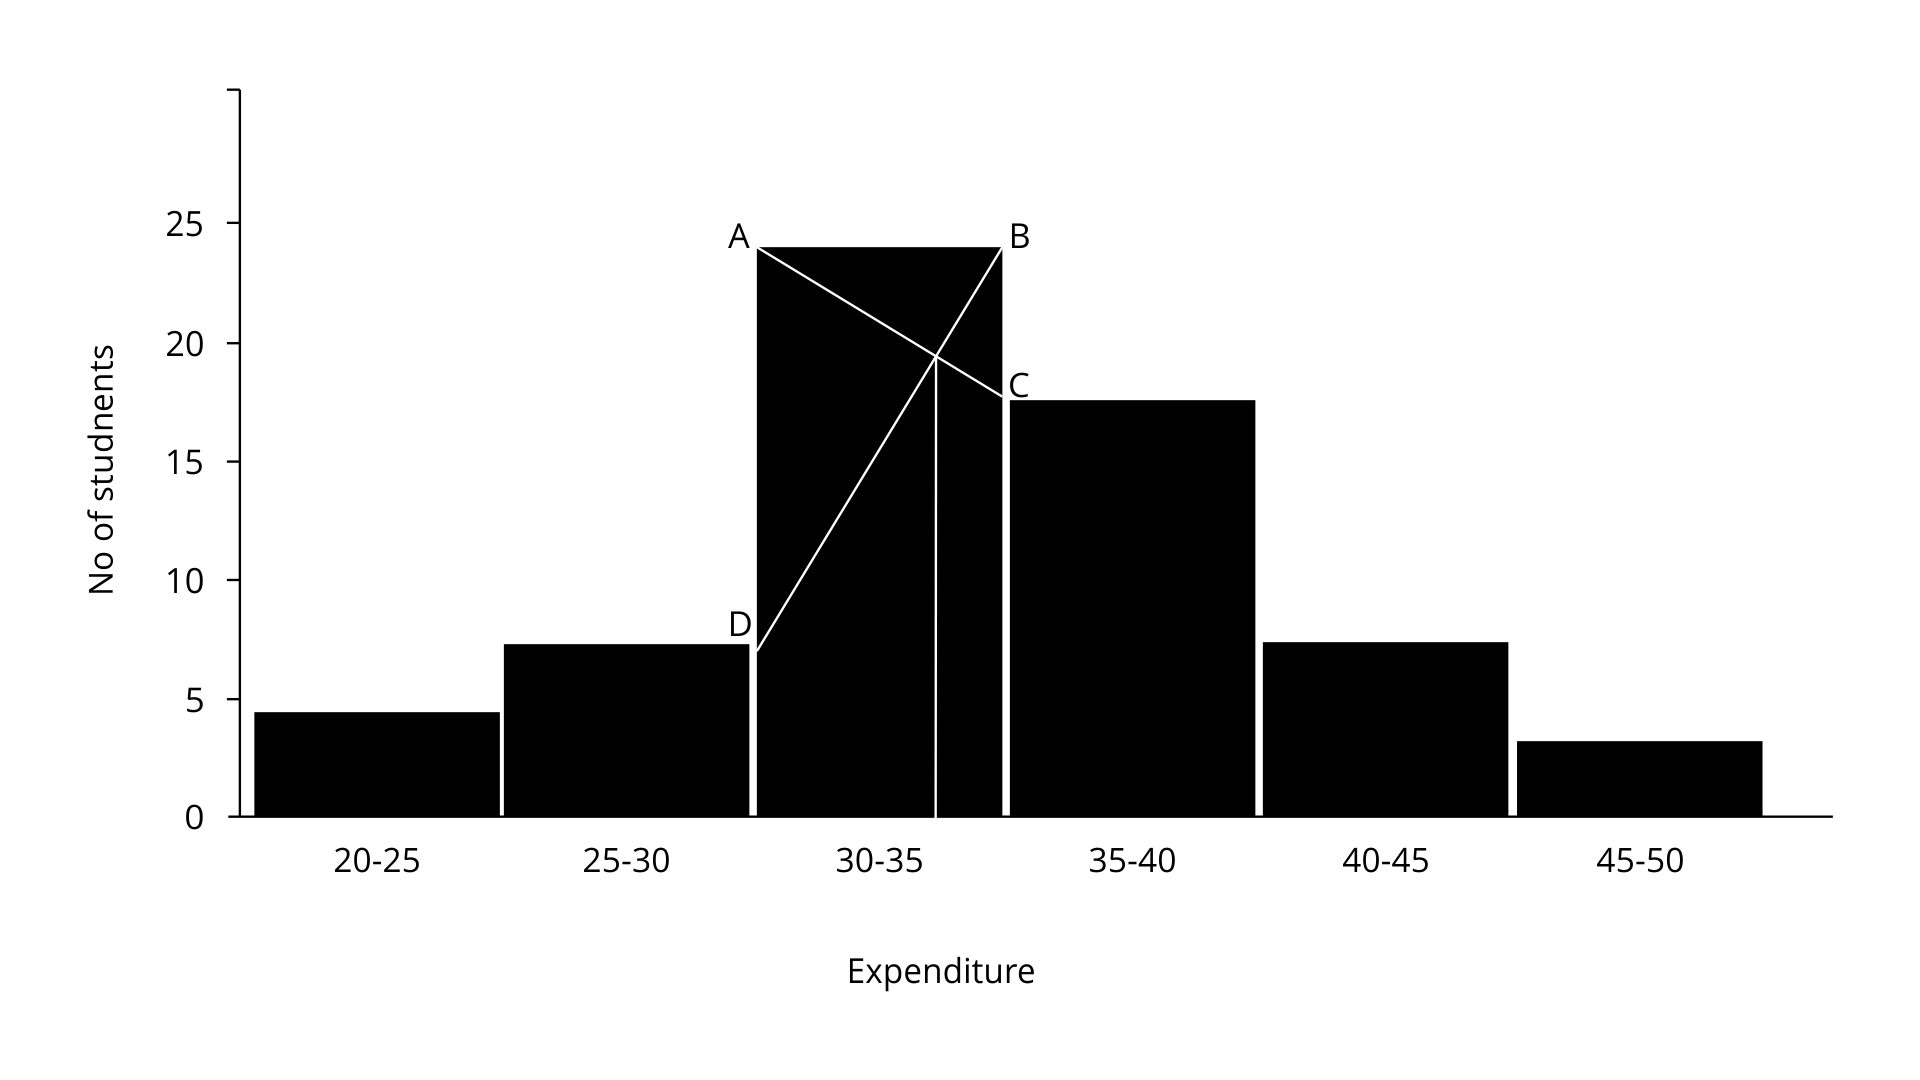
Clearly it is evident that the mode is in 30-35 as it has the highest frequency which is 23.
5. Find the median and mode for the set of numbers 2,2,3,5,5,5,6,8 and 9.
Ans: The set of numbers given are 2,2,3,5,5,5,6,8 and 9
Median = $\dfrac{n+1}{2}$= $\dfrac{9+1}{2}$= 5th term.
The 5th term is the mode which is 5.
Mode: From definition we can say that mode is the value that appears most often in a set of data values.
Mode is 5 as it repeats a maximum number of times.
6. A boy scored following marks in various class tests during a term, each test being marked out of 20.
15,17,16,7,10,12,14,16,19,12,16.
(i) What are his modal marks ?
Ans: It is given that the boy scored the following marks out of 20.
15,17,16,7,10,12,14,16,19,12,16.
The first step is to arrange the given data in the ascending order: 7, 10,12, 12,14, 15,16,16, 16, 17,19.
(i) Mode is the value that appears most often in a set of data values.
From the definition we could easily say that mode is 16 as it occurs a maximum number of times.
(ii) What are his median marks ?
Ans: Median = $\dfrac{n+1}{2}= \dfrac{11+1}{2}$= 6th term which is 15.
(iii) What are his total marks ?
Ans: Now the total marks = 7 + 10+ 12+ 12+ 14+ 15+ 16 + 16+ 16+ 17+ 19= 154
(iv) What are his mean marks ?
Ans:Mean($\underset{\scriptscriptstyle-}{x}$)= $\dfrac{{{x}_{1}}+~{{x}_{2}}+.....+{{x}_{n}}}{x}$= $\dfrac{154}{11}$=14
7. Find the mean, median and mode of the following marks obtained by 16 students in a class test marked out of 10 marks.
0,0,2,2,3,3,3,4,5,5,5,5,6, 6,7,8
Ans: It is given that the marks obtained by 16 students in a class test marked out of 10 marks are 0,0,2,2,3,3,3,4,5,5,5,5,6, 6,7,8
(i) Mean = $\dfrac{{{x}_{1}}+~{{x}_{2}}+.....+{{x}_{n}}}{x}$= $\dfrac{64}{16}$= 4
(ii) Median = Mean of 8th and the 9th term = $\dfrac{4+5}{2}$= $\dfrac{9}{2}$= 4.5
(iii) Mode is the value that appears most often in a set of data values.
From the definition we could easily say that mode is 5 as it occurs a maximum number of times.
8. At a shooting competition the score of a com-petitor were as given below :
(i) What was his modal score ?
Ans:
Modal score = 4 as its frequency is 7, which is maximum.
(ii) What was his median score ?
Ans: Median = $\dfrac{n+1}{2}$= $\dfrac{25+1}{2}$=13th term which is 3
(iii) What was his total score ?
Ans: Total score = 80
(iv) What was his mean score ?
Ans: Mean = $\underline{x~}$= $\dfrac{\sum fi~xi}{\sum fi}$= $\dfrac{80}{25}$=3.2
Exercise 24(E)
1.The following distribution represents the height of 160 students of a school
Draw an ogive for the given distribution taking 2 cm = 5 cm of height on one axis and 2 cm = 20 students on the other axis. Using the graph, determine:
The median height.
Ans:
Now let us first draw an ogive taking into consideration the height of the student along the x-axis and the cumulative frequency along the y-axis.
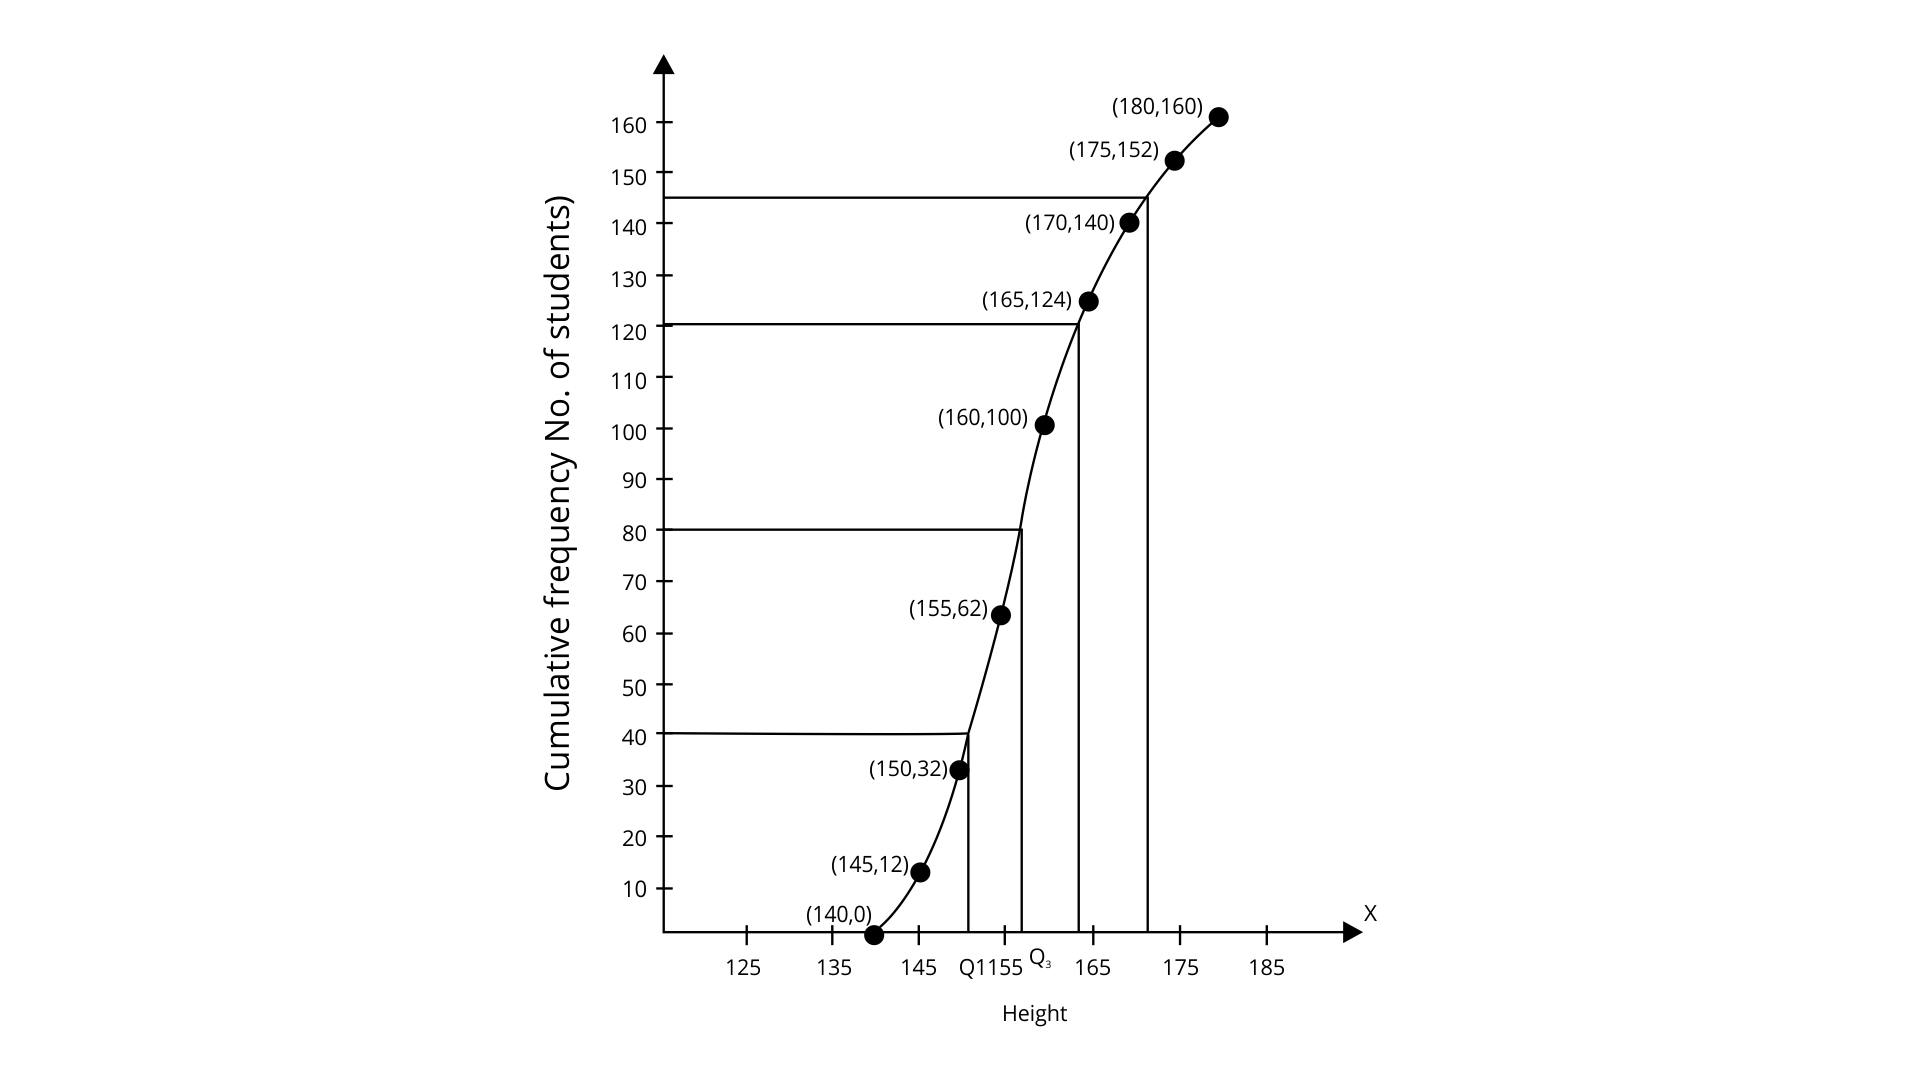
Median = 160/2 = 80th term
Now from the mark for 80, we have to draw a parallel line to the x-axis which then meets the curve, then from the curve, we should draw a vertical line that meets the x-axis at the mark of 157.5.
Determine the interquartile range.
Ans: To find the interquartile range.
We know that the number of terms = 160
Lower quartile (q1)= ($\dfrac{160}{4}$)= 4oth term = 152
Upper quartile (q3) = (3$\times \dfrac{160}{4}$) = 120th term = 164
Inner Quartile range = q3 – q1= 164-152=12.
The number of students whose height is above 172 cm.
Ans: To find the number of students whose height is above 172 cm. Draw a vertical line that meets the curve through the mark for 172 on the x-axis; then, from the curve, draw a horizontal line that meets the y-axis at the mark for 145.
Now, the number of students whose height is above 172cm =160-144=16.
2. Draw ogive for the data given below and from the graph determine:
The median marks.
Ans:
Here 1cm = 10 marks on X axis
1cm = 20 students on Y axis
(i) To Find the median marks.
So now the median = 120/2 = 60th term
Now through mark 60, draw a parallel line to the x-axis which meets the curve at A. From A, then draw a perpendicular to the x-axis meeting it at B.
Hence the value of point B is the median = 43.
(ii) Determine the Number of students who obtained more than 75% marks.
Ans: Now total marks = 100
75% of total marks = $\dfrac{75}{100}\times 100=75~marks~$
Hence now the number of students achieving more than 75% marks =120-111= 9 students.
3. The mean of 1, 7, 5, 3, 4 and 4 is m. The numbers 3, 2, 4, 2, 3, 3 and p have mean m – 1 and median q. Find p and q.
Ans: From the data given
Mean of 1, 7, 5, 3, 4 and 4 = $\dfrac{~\left( 1~+~7~+~5~+~3~+~4~+~4 \right)}{6}$= $\dfrac{24}{6}$= 4
Hence, m = 4.
Now mean of 3, 2, 4, 2, 3, 3 and p = m-1 = 4-1=3
Thus, 17+p = 3$\times n......,$where n = 7
17+p =21
p = 4
Now arrange the terms in an ascending order we get:
2, 2, 3, 3, 3, 3, 4, 4
Mean = 4th term = 3
Hence q =3.
4. In a malaria epidemic, the number of cases diagnosed were as follows:
On what days do the mode and upper and lower quartiles occur?
Ans:
(i) Mode is calculated with the number which has the highest frequency and so the mode is 5th July as it has the maximum frequency.
(ii) Total number of terms = 206
Upper quartile = 206 $\times \dfrac{3}{4}$= 154.5th = 7th July
Lower quartile = 206 $\times \dfrac{1}{4}$= 51.5th = 4th July
5. The income of the parents of 100 students in a class in a certain university is tabulated below.
(i) Draw a cumulative frequency curve to estimate the median income.
Ans: To draw the cumulative frequency curve.
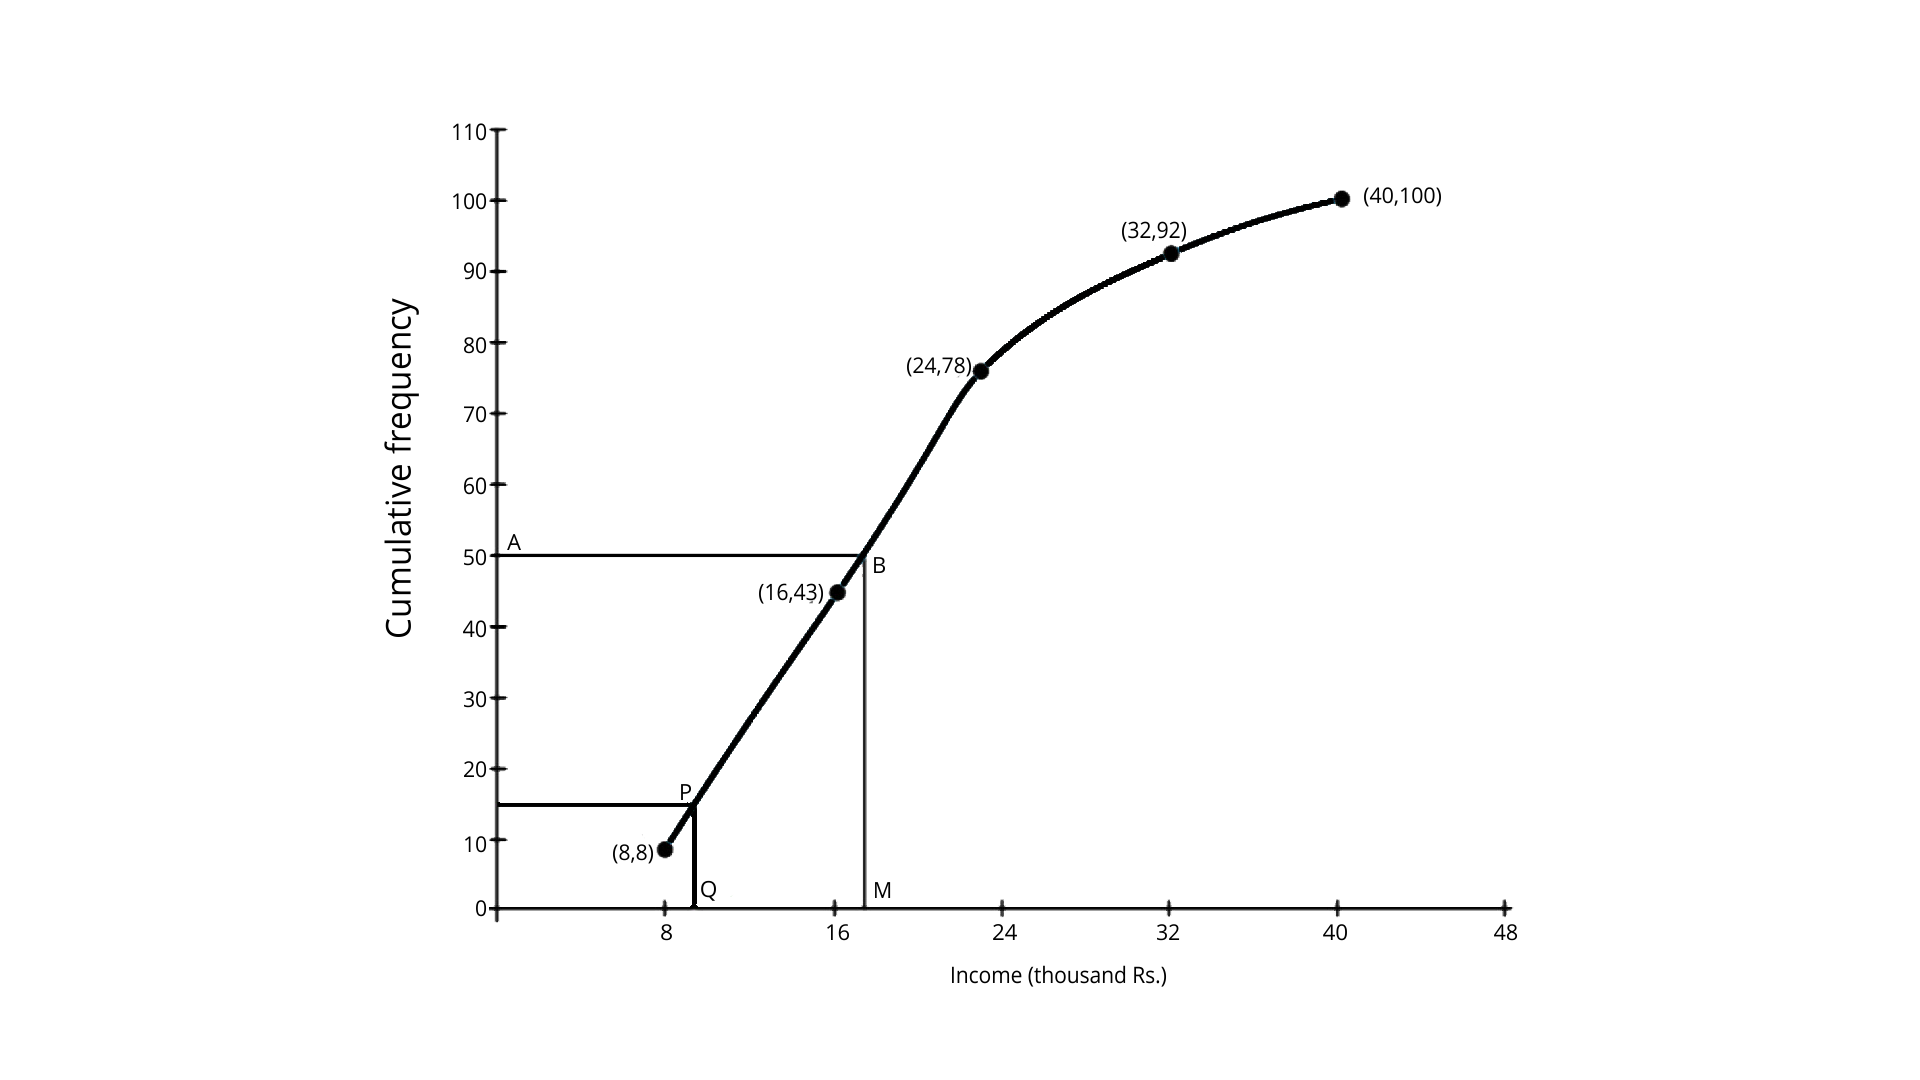
We have to plot the points (8, 8), (16, 43), (24, 78), (32, 92) and (40, 100) to get the curve as follows.
Here, N = 100
$\dfrac{N}{2}$= 50
At y= 50, affix A.
Draw a horizontal line which then meets the curve at B through A.
Now through B draw a vertical line which then meets OX at M.
OM = 17.6 units.
Hence, median income = 17.6 thousands.
(ii) If 15% of the students are given free ships on the basis of the income of their parents, find the annual income of parents, below which the freeships will be awarded.
Ans: Now 15% of 100 students = $\dfrac{\left( 15\times 100 \right)}{100}$=15
From the cumulative frequency 15 , draw a horizontal line which then intersects the curve at P.
Now from P, draw a perpendicular to the x-axis which meets it at Q which is equal to 9.6.
Hence, freeship would be provided to the students providing the annual income of their parents is close to 9.6 thousands.
(iii) Calculate the Arithmetic mean
Ans: Arithmetic mean = $\dfrac{\sum ~fx}{~\sum ~f}$= $\dfrac{1832}{100}$= 18.32
6. The marks of 20 students in a test were as follows:
2, 6, 8, 9, 10, 11, 11, 12, 13, 13, 14, 14, 15, 15, 15, 16, 16, 18, 19 and 20.
Calculate:
(i) the mean
Ans: Now the first step is to arrange the terms in an ascending order:
2, 6, 8, 9, 10, 11, 11, 12, 13, 13, 14, 14, 15, 15, 15, 16, 16, 18, 19, 20
Number of terms = 20
∑ x = 2 + 6 + 8 + 9 + 11 + 11 + 12 + 13 + 13 + 14 + 14 + 15 + 15 + 15 + 15 + 16 + 16 + 18 + 19 + 20 = 257
(i) Mean = $\dfrac{\sum x}{\sum n}$= $\dfrac{257}{20}$= 12.85
(ii) Calculate the median
Ans: Median = $\dfrac{\left( 10th~term~+~11th~term \right)}{2}$= $\dfrac{\left( 13+14 \right)}{2}$= 13.5
(iii) Calculate the mode
Ans: Mode = The mode is 15 as it has the maximum frequency which is 3.
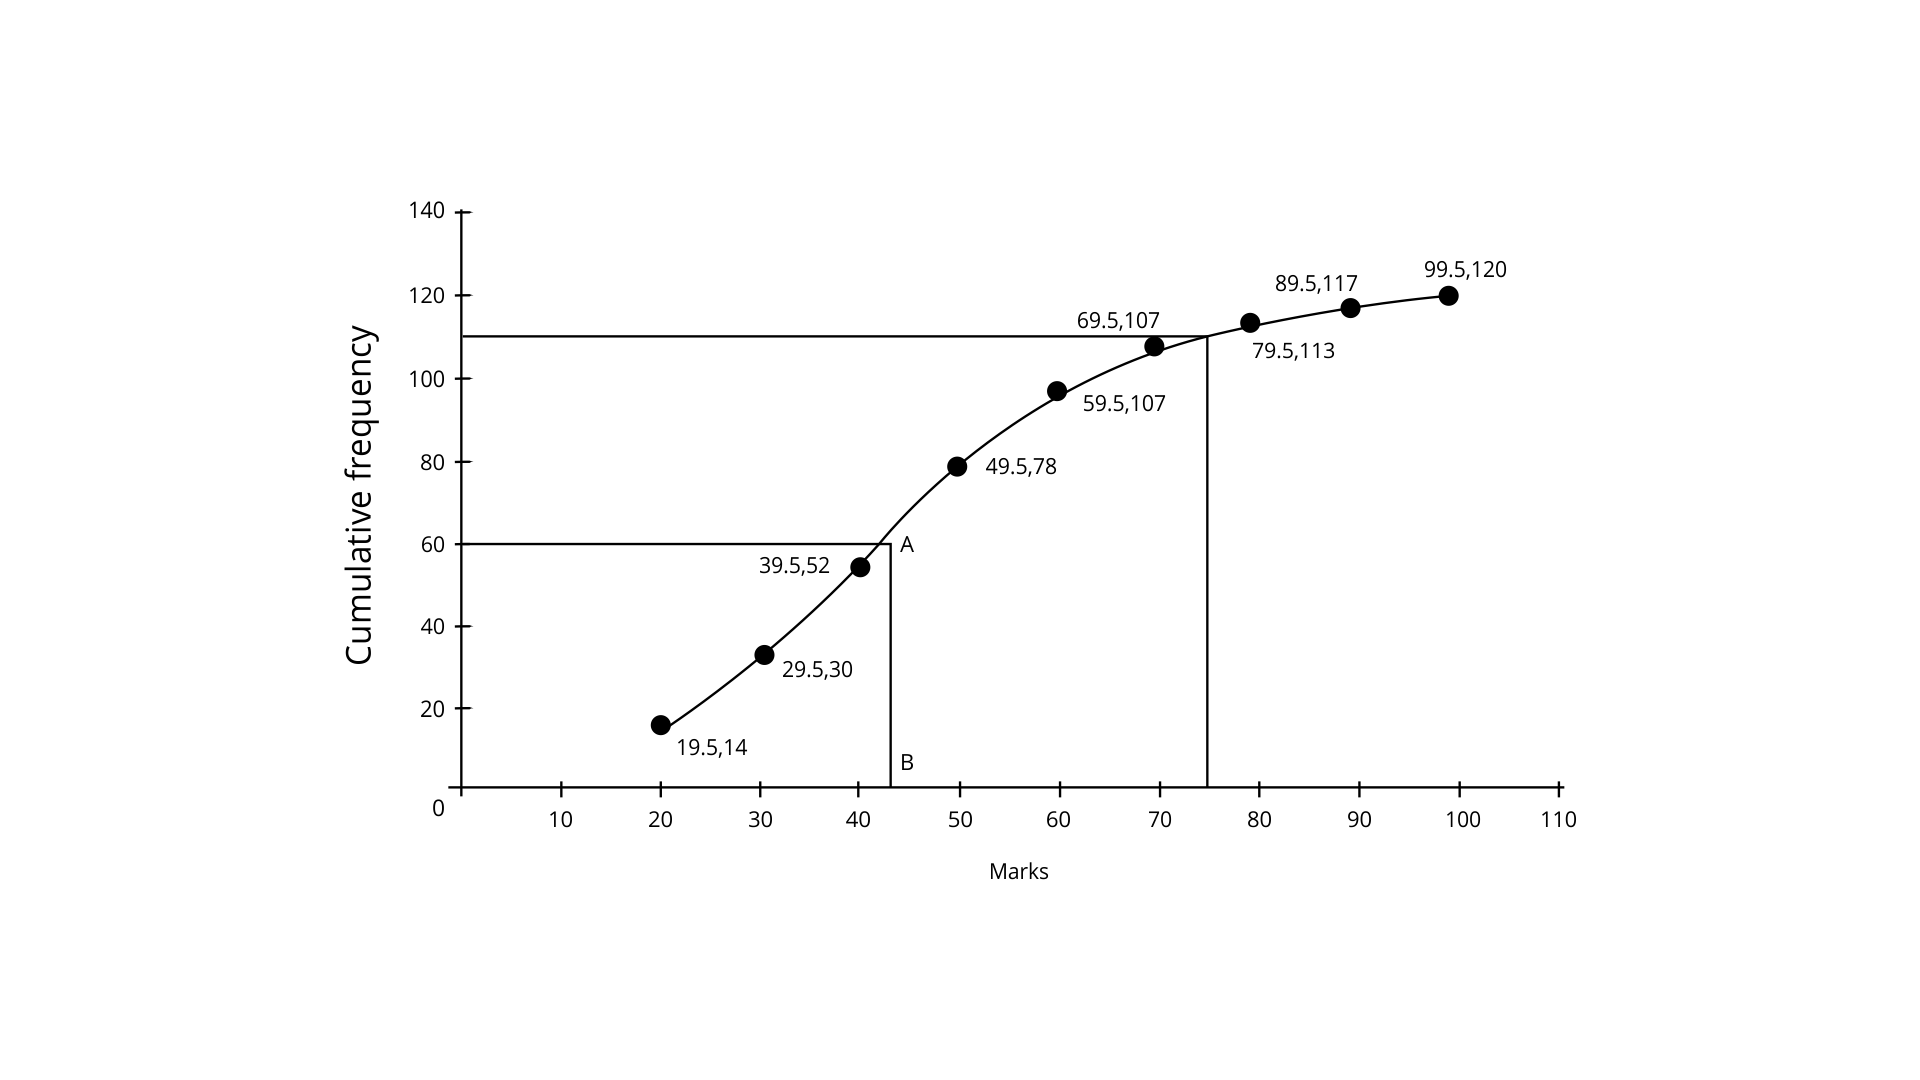
7. The marks obtained by 120 students in a mathematics test is given below:
Draw an ogive for the given distribution on a graph sheet. Use a suitable scale for your ogive. Use your ogive to estimate:
(i) the Median
Ans:
(i) From the graph, the median = $\dfrac{\left( 120+1 \right)}{2}$= 60.5 th term
Now through mark 60.5, draw a parallel line to the x-axis which then meets the curve at A. Then from A draw a perpendicular to x-axis which meets it at B
The value of point B is the median = 43
(ii) the number of students who obtained more than 75% in the test.
Ans: The number of students who obtained more than 75% in the test?
Number of students who obtained up to 75% marks in the test = 110.
Number of students who obtained more than 75% marks in the test = 120 – 110 = 10.
(iii) Use your ogive to estimate the number of students who did not pass in the test if the pass percentage was 40.
Ans: The number of students who obtained less than 40% marks in the test = 52 as from the graph x=40 and y = 52.
(iv) Use your ogive to estimate the lower quartile
Ans: Lower quartile = q1= 120 $\times $$\left( \dfrac{1}{4} \right)$ = 30th term = 30
8. Using a graph paper, draw an ogive for the following distribution which shows a record of the width in kilograms of 200 students.
Use your ogive to estimate the following:
(i) The percentage of students weighing 55 kg or more
Ans:
(i) The number of students weighing more than 55 kg = 200 - 44 = 156
Thus, the percentage of students weighing 55 kg or more = 200 - 44 = 156
Now the percentage of students weighing 55 kilograms or more=$\dfrac{156}{200}\times 100=78%$
(ii) Use your ogive to estimate the weight above which the heaviest 30% of the student fall
Ans: 30% of students = $\dfrac{\left( 30\times 200 \right)}{100}$= 60
Heaviest 60 students in weight = 9+21+30=60
Weight = 65 kilogram
(iii) Use your ogive to estimate the number of students who are (a) underweight (b) overweight, if 55.70 kg is considered as standard weight.
Ans: The number of students who are (a) underweight (b) overweight, if 55.70 kg is considered as standard weight?
Underweight students when 55.70 kg is standard = 46 from the graph.
Overweight students when 55.70 kg is standard = 200 - 55.70 = 154 from the graph.
9. The distribution, given below, shows the marks obtained by 25 students in an aptitude test. Find the mean, median and mode of the distribution.
Ans:
Now we know that the number of terms = 25
(i) Mean = $\dfrac{171}{25}$= 6.85
(ii) Median = $\dfrac{\left( 25+1 \right)}{2}$= 13th term = 7
(iii) Mode = 6 is the mode as it has the maximum frequency which is 6.
10. The mean of the following distribution is 52 and the frequency of class interval 30 – 40 is ‘f’. Find f.
Ans:
Mean = $\dfrac{\sum ~fx}{\sum ~f}$= $\dfrac{\left( 1940~+~35f \right)}{\left( 36~+~f \right)}$…… (i)
Now it is given that the mean = 52 …….(ii)
Equating (i) and (ii) we have
$\dfrac{\left( 1940~+~35f \right)}{\left( 36~+~f \right)}$=52
1940+35f = 1872+52f
17f = 68
Thus, f =4
11. The monthly income of a group of 320 employees in a company is given below:
Draw an ogive of the given distribution on a graph paper taking 2 cm = Rs 1000 on one axis and 2 cm = 50 employees on the other axis. From the graph determine:
(i) the Median Wage.
Ans:
It is given that the number of employees = 320
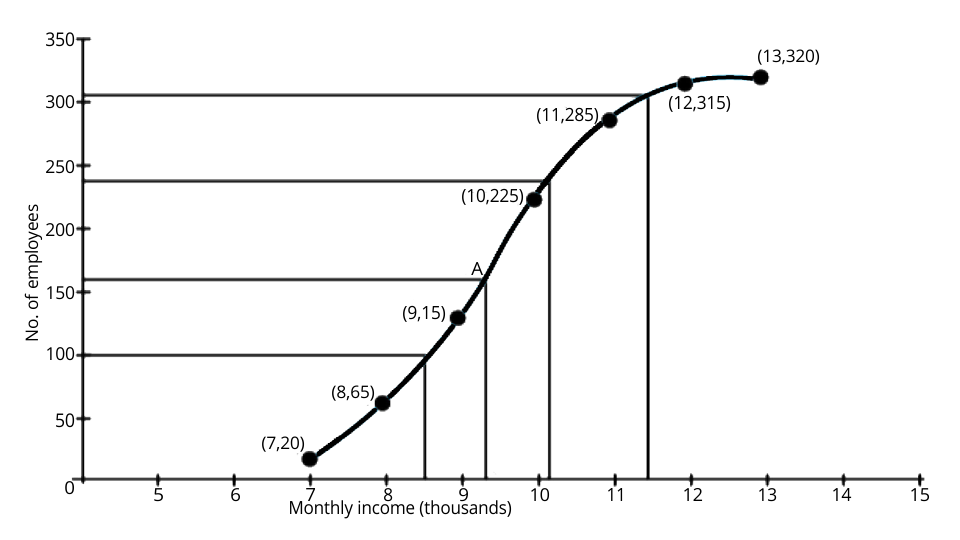
(i) Median = 320/2 = 160th term
From the mark 160, draw a parallel line to the x-axis which then meets the curve at A.Now from A draw a perpendicular to x-axis meeting it at B.
From here the value of point B is the median = rupees 9.3 thousands
(ii) From the graph determine the number of employees whose income is below Rs 8500.
Ans: The number of employees with the income below Rs 8,500 = 95 (approximately from the graph).
(iii) From the graph determine if the salary of a senior employee is above Rs 11,500, find the number of senior employees in the company.
Ans: Number of employees with income below Rs 11,500 = 305 ((approximately from the graph).
Hence now from the graph, the number of senior employees = 320 - 305 = 15
(iv) From the graph determine the upper quartile.
Ans: The upper quartile = Q3= 320 $\times \dfrac{3}{4}$=240th term = Rupees 10,300.
12. A Mathematics aptitude test of 50 students was recorded as follows :
Draw a histogram for the above data using a graph paper and locate the mode.
Ans:
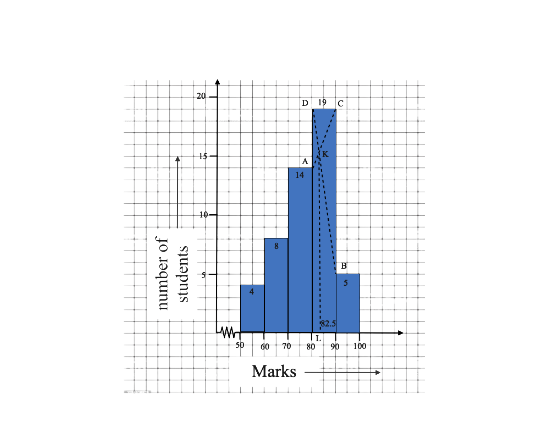
Now first draw the histogram with the given data.
Draw two lines AC and BD diagonally from the upper comer C and D or adjacent rectangle that intersect at K inside the highest rectangle that represents the maximum frequency (or modal class).
Now draw KL perpendicular to the X-axis.
From the histogram the value of L is the mode which is approximately 82.5.
13. Marks obtained by 200 students in an examination are given below :
Draw an ogive for the given distribution taking 2 cm = 10 marks on one axis and 2 cm = 20 students on the other axis. Using the graph, determine
(i) The Median Marks.
Ans:
From the tabular column we can say that the median is 57.
(ii) Using the graph, determine the number of students who fail the minimum marks required to pass is 40.
Ans: To find the number of students who failed if the minimum marks required to pass is 40. 44 students have failed if the minimum marks required to pass is 40.
(iii) Using the graph, determine if scoring 85 and more marks is considered as grade one, find the number of students who secured grade one in the examination.
Ans: We have to find the number of students who secured grade one in the examination if scoring 85 and more marks is considered as grade one.
The number of students who secured grade one = 200-188=12.
14. Marks obtained by 40 students in a short assessment are given below, where a and ft are two missing data.
Ans:
35+a+b = 40
a+b = 5
$\Rightarrow b=5-a~...........\left( 1 \right)$
$\Rightarrow ~$We know that mean = $\dfrac{\Sigma \left( fx \right)}{\Sigma f}$
$\Rightarrow $7.2 = $\dfrac{246+6a+9b}{40}$
$\Rightarrow $246+6a+9b = 288
$\Rightarrow $6a+9b=288-246
$\Rightarrow $6a+9b=42
$\Rightarrow $2a+3b=14 ….(2)
Substituting the value of b from (1) in (2)
2a+3(5-a)=14
a= 1
Now substitute the value of a in (1)
b=5-1=4
By solving (1) and (2) we get a=1, b= 4
15. Find the mode and median of the following frequency distribution :
Ans:
Here from the tabular column we can say that n=29 (odd)
Median = value of ($\dfrac{29+1}{2}$)th observation = Value of 15th observation =13
The mode is 14 as the frequency corresponding to 14 is maximum.
16. The median of the following observations 11, 12, 14, (x – 2), (x + 4), (x + 9), 32, 38, 47 arranged in ascending order is 24. Find the value of x and hence find the mean.
Ans: It is given that the median of the following observations 11, 12, 14, (x – 2), (x + 4), (x + 9), 32, 38, 47 arranged in ascending order is 24.
Observation are :
11, 12, 14, (x – 2), (x + 4), (x + 9), 32, 38, 47
From here n = 9
Therefore median = ${{\left( \dfrac{9+1}{2} \right)}^{th}}$term
5th term = x+4
24 = x+4
x=24-4
x=20
Now substitute the value of x in the given data
11, 12, 14, (20 – 2), (20 + 4), (20 + 9), 32, 38, 47
11, 12, 14, 18, 24, 29, 32, 38, 47
Now mean = sum of all the numbers / total numbers
Mean = 225/9 = 25
Mean = 25
17. The numbers 6, 8, 10, 12, 13 and x are arranged in an ascending order. If the mean of the observations is equal to the median, find the value of x.
Ans: Now arrange the numbers in an ascending order
6,8,10,12,13,x
Mean = sum of all the numbers / total numbers
Mean =$\dfrac{6+8+10+12+12+x}{6}$= $\dfrac{49+x}{6}$
Number of terms (n) = 6 which is even number
Therefore now median = $\dfrac{3rd+4th}{2}$= $\dfrac{10+12}{2}$= 22/2 =11
According to the statement given,
$\dfrac{49+x}{6}$=11
x= 17
18. (Use a graph paper for this question.) The daily pocket expenses of 200 students in a school are given below:
Draw a histogram representing the above distribution and estimate the mode from the graph.
Ans: Step by step procedure for construction:
The first step is to draw a line BC which is equal to 6.5 cm.
From centre B and C draw arcs AB = 5.5 cm and AC= 5 cm
Now after joining AB and AC, ABC is the required triangle.
Now draw the angle bisectors of B and C and let these bisectors meet at O.
Now taking O as the centre, draw an incircle which then touches all the sides of the triangle ABC.
Now from O draw a perpendicular to the side BC which cuts at N.
Measure ON which is then the required radius of the incircle.
ON = 1.5 cm
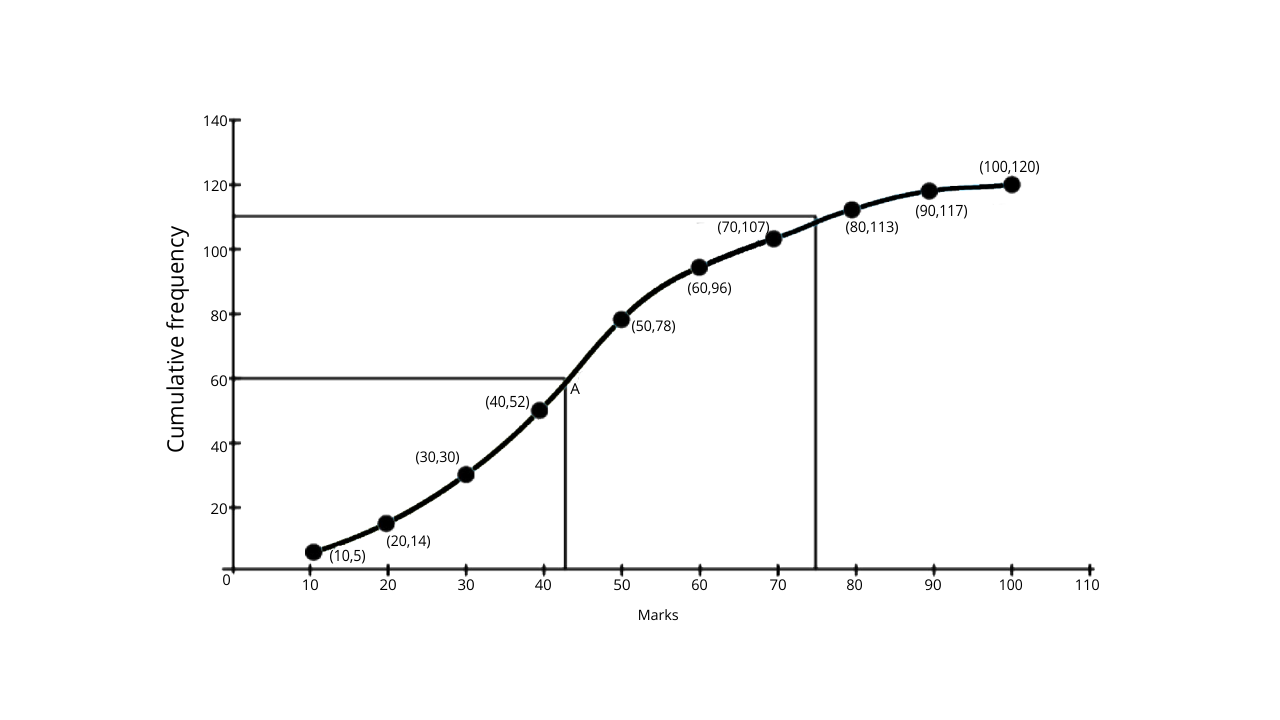
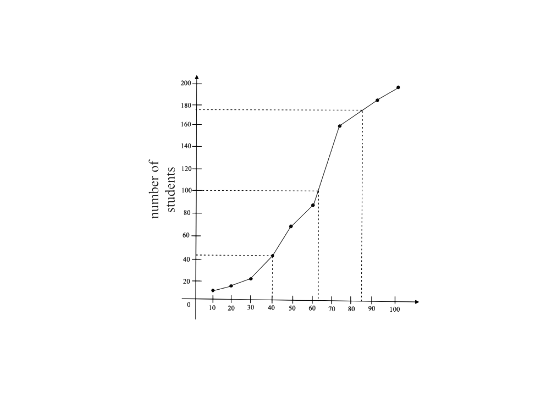
19. The marks obtained by 100 students in a Mathematics test are given below:
Draw an ogive for the given distribution on a graph sheet.
Use a scale of 2 cm 10 units on both axes.
Use the ogive to estimate the:
(i) median.
Ans:
(i)To find the median:
From the tabular column created we can say that,
N= 100
Median = $\dfrac{100}{2}$= the 50th term median = 45
(ii) Use the ogive to estimate the lower quartile.
Ans: Lower quartile : (Q1)
N=100
⇒ $\dfrac{N}{4}$ = $\dfrac{100}{4}$= 25
Therefore Q1= 32
(iii) Use the ogive to estimate the number of students who obtained more than 85% marks in the test.
Ans: The number of students with 85% less = 94
Therefore more than 85% marks = 100- 94 =6
(iv) Use the ogive to estimate the number of students who failed, if the pass percentage was 35.
Ans: The number of students who failed = 30
20. The mean of the following numbers is 68. Find the value of ‘x’.
45, 52, 60, x, 69, 70, 26, 81 and 94.
Hence, estimate the median.
Ans: It is given that the mean of the following numbers 45, 52, 60, x, 69, 70, 26, 81 and 94 is 68. We have to find the value of x.
Mean by definition is given by,
Mean = Sum of all the observations/ total number of observations
68 = $\dfrac{45+52+60+x+~69+70+26+81+94.}{9}$
68= $\dfrac{497~+~x}{9}$
x= 115
Now arrange the numbers in an ascending order which will give us,
26,45,52,60,69,70,81,94,115.
As the number of observations is odd, the median is the ${{\left( \dfrac{n+1}{2} \right)}^{th}}$observation.
Median = ${{\left( \dfrac{9+1}{2} \right)}^{th}}$observation = 5th observation
Hence the median is 69.
21. The marks of 10 students of a class in an examination arranged in ascending order is as follows:
13, 35, 43, 46, x, x + 4, 55, 61, 71, 80
If the median mark is 48, find the value of x. Hence, find the mode of the given data.
Ans: It is given that the median mark is 48 and we have to find the value of x.
From the given data we can say that the number of observations is 10, which is an even number.
Median = $\dfrac{{{\left( \dfrac{n}{2} \right)}^{th}}term~+~~{{\left( \dfrac{n}{2}+1 \right)}^{th}}term~}{2}$
48 = $\dfrac{5th~term~+~6th~term~}{2}$= $\dfrac{x+x+4}{2}$
96 = 2x+4
x=46
Now the given data is 13,35, 43,46,50,55,61,71,80
In the given data, 46 occurs the most number of times and hence mode = 46.
22. The daily wages of 80 workers in a project are given below.
Use a graph paper to draw an ogive for the above distribution. (Use a scale of 2 cm = Rs. 50 on x – axis and 2 cm = 10 workers on y – axis). Use your ogive to estimate.
i. The median wages of the workers.
Ans:
We have to use the table to draw an ogive,
The ogive is as follows:
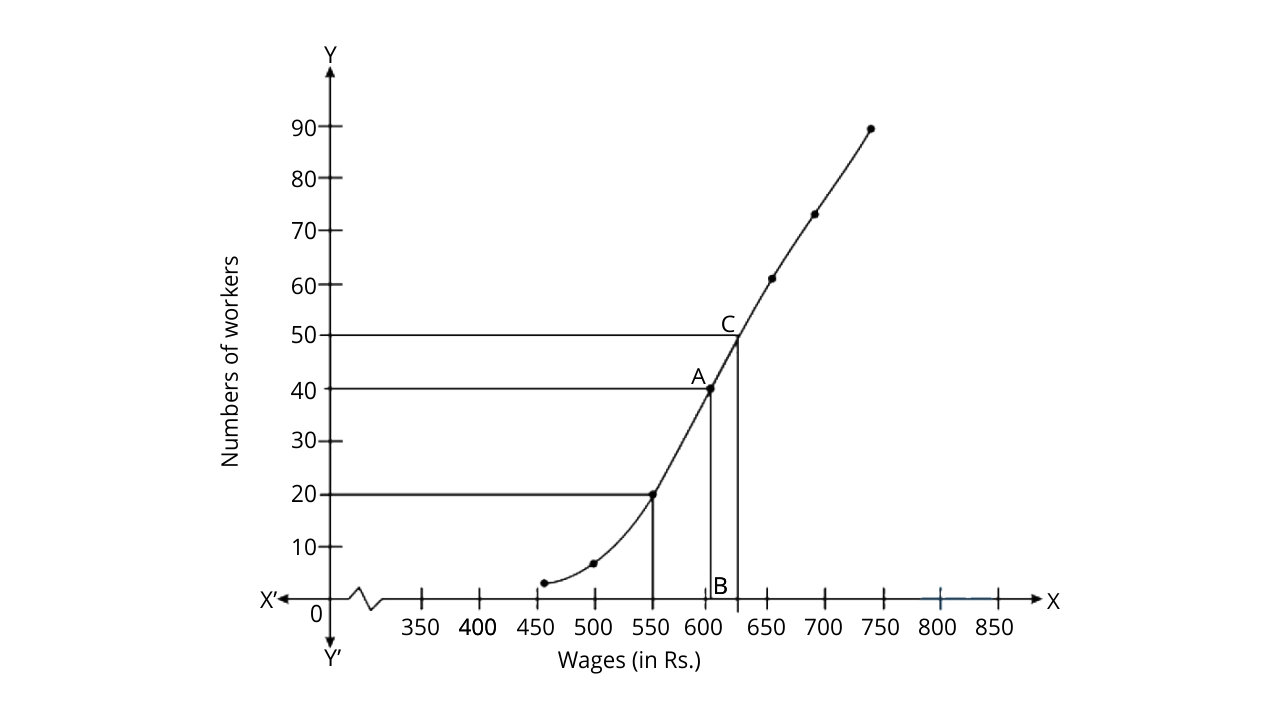
We know that the number of workers = n = 80
Median = ${{\left( \dfrac{n}{2} \right)}^{th~}}$term = 40th term, Now draw a horizontal line which then meets the curve at the point A.
Draw a vertical line which is parallel to the y axis from A to meet x axis at B.
The value of point B is 605.
ii. Use your ogive to estimate the lower quartile wage of workers.
Ans: To find the lower quartile:
Lower quartile (q1)= ${{\left( \dfrac{n}{4} \right)}^{th~}}$term = 20th term = 550
iii. Use your ogive to estimate the number of workers who earn more than Rs. 625 daily.
Ans: Now through the mark of point 625 on the x axis, draw a vertical line which then meets the graph at the point C. Then now through the point C, draw a horizontal line which meets the y axis at the mark of 50.
Hence from the number of workers that earn more than rupees 625 daily =80-50= 30
23. The histogram below represents the scores obtained by 25 students in a Mathematics mental test. Use the data to :
(i) Frame a frequency distribution table
Ans:
(i) To frame the frequency distribution table:
(ii) Use the data to calculate mean
Ans: To calculate mean
Therefore now the mean is given by = $\dfrac{\Sigma fx}{\Sigma f}$= $\dfrac{695}{25}$= 27.8.
(iii) Use the data to determine the Modal class
Ans: To determine the Modal class
Here we know that the maximum class frequency is 8, and the class that corresponds to this frequency is 20-30.Hence the modal class is 20-30,.
Download ICSE Class 10 Mathematics Chapter 24 Selina Concise Solutions
ICSE Class10 Maths Chapter 24 seems a little complicated as students find difficulty in learning the different measures of central tendency. The measure of the central tendency is one of the statistical concepts that represent the single value of the entire data set. The central tendency of a given dataset can be measured by using three important measures as Mean, median, and mode.
ICSE Class 10 Mathematics Chapter 24 Selina Concise Solutions provided on this page is an ideal study material that can help you to explore the important topics of this chapter. It not merely helps you to understand the important segment of the chapter but also enables you to deal with complicated questions. This will also help you to enhance your preparation, and subsequently your final scores.
You can download ICSE Class 10 Mathematics Chapter 24 Selina Concise Solutions free PDF just by tapping once on the link shown. The PDF has been designed by the subject experts who have extensive years of experience in teaching ICSE students. To ease your ICSE Class 10 Mathematics Chapter 24 preparation, download the PDF now.
Introduction:
This ICSE solution for Concise Mathematics contains the problems with their respective solutions. Mean, Median, Quartiles and Mode are important concepts of statistics. These mathematical techniques help in the study of various data, such as industrial production, wages and salaries, savings and investment patterns etc.
What is Mean?
The arithmetic mean or average is a measure of central tendency or location commonly used in the analysis of continuous data distributions. It is defined as the sum of all values in a data sample, divided by the total number of data points. It helps to understand a typical or common value in a set of scores. The formula for Mean is:
Mean = Sum of all data point / Total no. of data points
What is Median?
The middle number in a set of scores is called the median. This point divides the observations into two equal parts, one part containing lower observation and the other higher observation.
When there is an odd number of observations present (where n is odd), the median is found by finding the Mean of the two middle observations.
Quartiles:
A quartile is the value of the observation that separates the upper quarter of observations below it and the lower quarter of observations above. The interquartile range (IQR) is the difference between the first quartile (Q1) and third quartile (Q3).
IQR = Q3 - Q1
A box plot is the graphical representation of data. The box plot shows five number summaries about the distribution of the variable: minimum, first quartile (Q1), median, third quartile (Q3) and maximum.
What is Mode:
Mode is the most often occurring value in a set of observations. Mode is most commonly used in descriptive statistics to represent the central tendency of a data set. Barcharts depict the mode of a data set by using different shapes for different modes.
Benefits of Selina Concise Mathematics Class 8 ICSE Solutions For Chapter 24 Measure of Central Tendency Free PDF
With a view to getting a stronghold of the Mathematics chapter, practice is the ultimate solution that can enhance the problem-solving skills of the students. In order to help you with the preparation of ICSE Class 10 Mathematics Chapter 24, Vedantu subject experts have made an effort to provide you with reliable and accurate ICSE Class 10 Mathematics Chapter 24 Selina Concise Solutions. Here are some of the benefits of referring to the solutions:
Accuracy is the important component that can be found in ICSE Class 10 Mathematics Chapter 24 solutions offered by Vedantu as the solutions are formulated by the subject matter experts.
The solutions are formulated as per the latest guidelines and syllabus issued by the board. Hence, students can rely on these solutions without any concern.
Students will get an opportunity to explore different areas of the chapter with the help of these solutions. Along with that, students will also learn the feasible methods of solving the questions that will eventually enhance their time-management skills.
As the topics covered in the chapter are completely focused on calculation and procedures, proper hold over each topic is crucial. The solutions enable you to work on your weaker areas that need improvement to score better.
Apart from that, ICSE Class 10 Mathematics Chapter 24 solutions ensure that students do not get confused with so many different concepts covered in the chapter. All the questions given in each exercise are properly structured so that the students understand the topics well. Hence, ICSE Class 10 Mathematics Chapter 24 Selina Concise Solutions is a useful study material to improve your grades.


FAQs on Concise Mathematics Class 10 ICSE Solutions for Chapter 24 - Measures of Central Tendency (Mean, Median, Quartiles and Mode)
1. Define Central Tendency?
In statistics, central tendency is defined as the statistical measure that denotes the single value of the entire distribution of the data set. It aims to provide a precise description of the comprehensive data in the distribution.
The central tendency of the data can be determined by using four measures namely mean, median, mode, and midrange.
2. What is the Aim of Central Tendency?
3. What are the Key Features of Selina Concise Mathematics Class 8 ICSE Solutions For Chapter 24?
Some of the key features of Selina Concise Mathematics ICSE Solutions for Chapter 24 are discussed below:
Concise Mathematics Class 8 ICSE Solutions for Chapter 24 are available in PDF format for free.
The PDF includes solutions to all the numerical questions covered in Selina Concise Mathematics Chapter 24.
The solutions are accurate and reliable as they are prepared by the subject experience teachers.
Relevant diagrams are provided to help students to understand the question in a better way.
Proper understanding of each question will not only help students to clear their upcoming Class 8 exams but also prepare them for the competitive exams.
4. Is There any Time Charge to Access Concise Mathematics Class 8 ICSE Solutions for Chapter 24?
5. How will Concise Mathematics Class 10 ICSE Solutions help me to gain knowledge?
6. How do I get access to ICSE Class 10 Mathematics Chapter 24 solutions?
It is very easy. You simply have to follow the steps stated below:
Click on the provided link that we have given on this page.
Open the solution file and check out whether everything is consistent or not. You can also check the solutions of the previous chapters.
Once you are satisfied with all the details mentioned in the solution file, click on download. The PDF will be downloaded on your device very easily
9. Following the concepts taught in chapter 24 of class 10 ICSE Maths, how do you find the median example?