


Class 8 Maths important questions with answers PDF download
Vedantu provides important questions for Class 8 Maths, which are important questions according to the CBSE Class 8 Maths Syllabus, to support students' exam preparation. This resource emphasises the key themes and concepts from the text, helping students concentrate on the most critical elements. By practising these essential questions, students can deepen their understanding and build their confidence. Whether for a quick review or a comprehensive study, this collection is created to support students in achieving better results in exams. Download the FREE PDF to enhance your preparation!
 Table of Content
Chapter-wise Important Questions Class 8 Maths (New Syllabus)
CBSE Class 8 Maths Chapter-wise Important Questions (Old Syllabus)
1. Tell what property allows you to compute
$\dfrac{1}{3}\times(6 \times \dfrac{4}{3})$ as $(\dfrac{1}{3}\times 6)\times \dfrac{4}{3} $
Ans: Since, $a\times(b\times c)= (a \times b)\times c$.
2. Solve and check result: $5t-3=3t-5$
Ans:
\[5t-3=3t-5\]
On Transposing \[3t\] to L.H.S and \[-3\] to R.H.S, we obtain
\[5t-3=-5-\left( -3 \right)\]
\[2t=-2\]
On dividing both sides by\[2\], we obtain
\[t=-1\]
L.H.S \[=5t-3=5\times \left( -1 \right)-3=-8\]
R.H.S \[=3t-5=3\times \left( -1 \right)-5=-3-5=-8\]
L.H.S. = R.H.S.
Hence, the result obtained above is correct.
3. Find the measure of each exterior angle of a regular polygon of 9 Sides.
Ans:
Given: a regular polygon with $9$ sides
We need to find the measure of each exterior angle of the given polygon.
We know that all the exterior angles of a regular polygon are equal.
The sum of all exterior angles of a polygon is ${360^ \circ }$.
Formula Used: ${\text{Exterior}}\;{\text{angle}} = \dfrac{{{{360}^ \circ }}}{{{\text{Number}}\;{\text{of}}\;{\text{sides}}}}$
Therefore,
The sum of all angles of a given regular polygon $ = {360^ \circ }$
Number of sides $ = 9$
Therefore, a measure of each exterior angle will be
$ = \dfrac{{{{360}^ \circ }}}{9} $
$ = {40^ \circ } $
4. The following number is not a perfect square. Give reason. $\text{1057}$
Ans:
The square of numbers may end with any one of the digits $0$, $1$\[,4\], $5$, $6$, or $9$. Also, a perfect square has an even number of zeroes at the end of it.
We can see that $1057$has its unit place digit as $7$.
Hence, $1057$cannot be a perfect square.
5. Find the smallest number by which the following numbers must be divided to obtain a perfect cube. The number is 81.
Ans: $ 81\text{ }=\text{ }\underline{3\text{ }\times \text{ }3\text{ }\times \text{ }3}\text{ }\times \text{ }3$ . Here, one 3 is extra which is not in a triplet. Dividing 81 by 3, will make it a perfect cube.
Thus, $ 81\text{ }\div \text{ }3\text{ }=\text{ }27\text{ }=\text{ }3\text{ }\times \text{ }3\text{ }\times \text{ }3$ is a perfect cube.
Hence, the smallest number by which 81 should be divided to make it a perfect cube is 3.
6. $72\% $ of $25$ students are good in mathematics. How many are not good in mathematics?
Ans: Total number of students $ = $ 25.
Percentage of students are good in mathematics $ = $$72\% $
Percentage of students who are not good in mathematics $ = $ $(100 - 72)\% $
$ \Rightarrow 28\% $
$\therefore $ Number of students who are not good in mathematics $ = $$28\% \times 25$
$ \Rightarrow \dfrac{{28}}{{100}} \times 25$
$ \Rightarrow \dfrac{{28}}{4}$
$ \Rightarrow 7$
Students are not good in mathematics $ = 7$
7. Find the areas of rectangles with the following pairs of monomials as their lengths and breadths respectively.
$\left( {{\text{p, q}}} \right){\text{; }}\left( {{\text{10m, 5n}}} \right){\text{; }}\left( {{\text{20}}{{\text{x}}^{\text{2}}}{\text{ , 5}}{{\text{y}}^{\text{2}}}{\text{ }}} \right){\text{; }}\left( {{\text{4x, 3}}{{\text{x}}^{\text{2}}}{\text{ }}} \right){\text{; }}\left( {{\text{3mn, 4np}}} \right){\text{ }}$
Ans: We know that,
Area of rectangle = length x breadth
Area of 1st rectangle = p x q = pq
Area of 2nd rectangle = ${{10m \times 5n = 10 \times 5 \times m \times n = 50mn}}$
Area of 3rd rectangle = ${\text{20}}{{\text{x}}^{\text{2}}}{{ \times 5}}{{\text{y}}^{\text{2}}}{{ = 20 \times 5 \times }}{{\text{x}}^{\text{2}}}{{ \times }}{{\text{y}}^{\text{2}}}{\text{ = 100}}{{\text{x}}^{\text{2}}}{{\text{y}}^{\text{2}}}$
Area of 4th rectangle = ${{4x }} \times {\text{ 3}}{{\text{x}}^{\text{2}}}{{ = 4 \times 3}} \times {{x}} \times {{\text{x}}^2}{\text{ = 12}}{{\text{x}}^3}$
Area of 5th rectangle ${{ = 3mn \times 4np = 3 \times 4 \times m \times n \times n \times p = 12m}}{{\text{n}}^{\text{2}}}{\text{p}}$
8. The shape of a garden is rectangular in the middle and semi-circular at the ends as shown in the diagram. Find the area and the perimeter of the garden (Length of rectangle is ${\text{20 - (3}}{\text{.5 + 3}}{\text{.5)m}}$)?
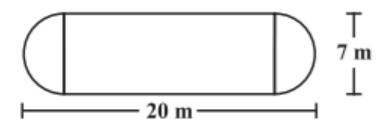
Ans: As we have given that length of rectangle = ${\text{[20 - (3}}{\text{.5 + 3}}{\text{.5)]m}}$
= ${\text{[20 - 7]m}}$= ${\text{13m}}$
Breadth = \[{\text{7m}}\].
Now, we have to find the circumference of both semi-circles.
As, Diameter = ${\text{7m}}$, so, Radius(r) = $\dfrac{7}{{\text{2}}}{\text{m}}$= ${\text{3}}{\text{.5m}}$
Circumference of one semicircle = ${\text{$\pi$ r}}$= $\dfrac{{{\text{22}}}}{{\text{7}}}{\text{(3}}{\text{.5)m}}$= ${\text{11m}}$
Circumference of both circles = ${\text{2 x 11m}}$= ${\text{22m}}$
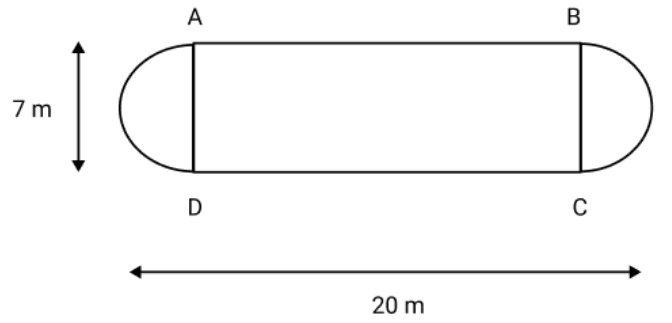
Now, the Perimeter of the garden = AB + CD + Length of both semi-circular regions AD & BC
= ${\text{(13 + 13 + 22)m}}$
= ${\text{48m}}$
Area of the garden = Area of the rectangle + $2 x $Area of two semi-circular regions
= (Length x Breadth) + ${\text{2 x }}\dfrac{{\text{1}}}{{\text{2}}}{\text{$\pi$ }}{{\text{r}}^{\text{2}}}$
= ${\text{[(13 x 7) + 2 x (}}\dfrac{{\text{1}}}{{\text{2}}}{\text{ x }}\dfrac{{{\text{22}}}}{{\text{7}}}{\text{ x 3}}{\text{.5 x 3}}{\text{.5)]}}{{\text{m}}^{\text{2}}}$
= ${\text{(91 + 38}}{\text{.5)}}{{\text{m}}^{\text{2}}}$
= \[{\text{129}}{\text{.5}}{{\text{m}}^{\text{2}}}\]
9. The following graph shows the temperature forecast and the actual temperature for each day of the week.
(a) On which days was the forecast temperature the same as the actual temperature?
(b) What was the maximum forecast temperature during the week?
(c) What was the minimum actual temperature during the week?
(d) On which day did the actual temperature differ the most from the forecast temperature?
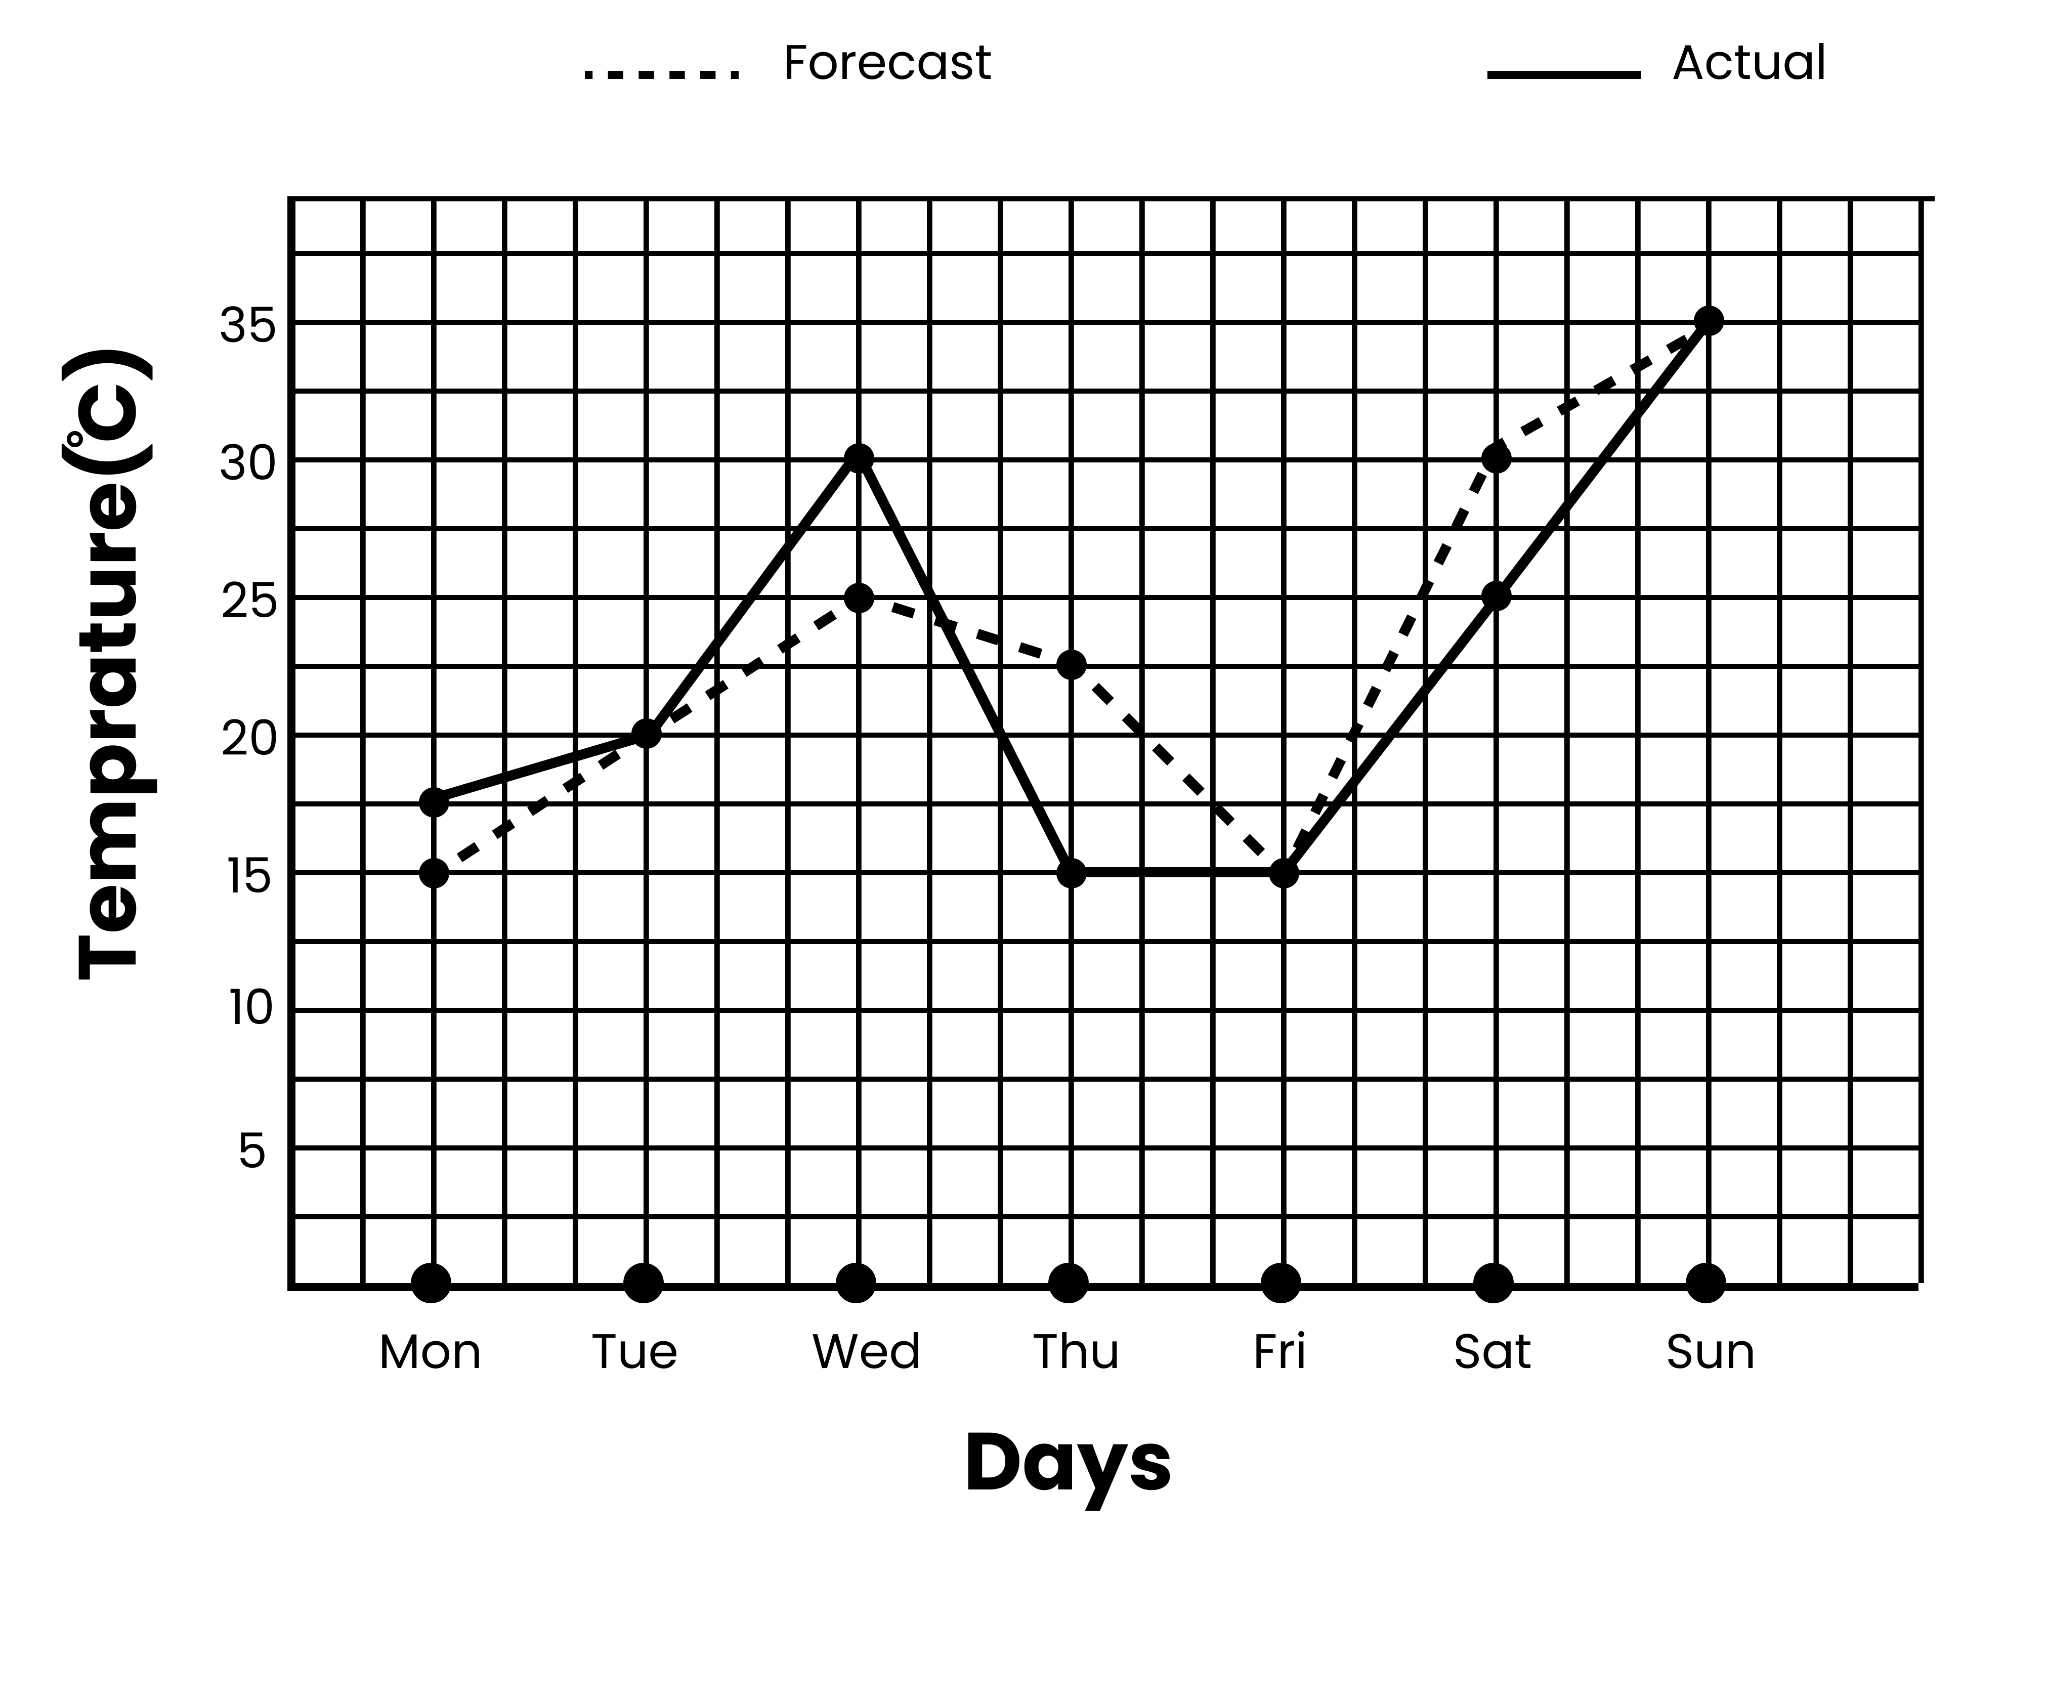
Graph Temperature Vs Days, Image Credits-NCERT
Ans: (a) On Tuesday, Friday, and Sunday, the forecast temperature matched the actual temperature.
(b)The maximum forecast temperature during the week was $35{}^\circ C$.
(c) The minimum actual temperature during the week was $15{}^\circ C$.
(d)On Thursday, the actual temperature differs the most from the forecast temperature.
10. Carry out the following divisions.
$28{{x}^{4}}\div 56x$
Ans: Write the numerator and denominator in its factors and divide.
$28{{x}^{4}}=2\times 2\times 7\times x\times x\times x\times x$
$56x=2\times 2\times 2\times 7\times x$
$28{{x}^{4}}\div 56x=\dfrac{2\times 2\times 7\times x\times x\times x\times x}{2\times 2\times 2\times 7\times x}$
$=\dfrac{{{x}^{3}}}{2}$
$=\dfrac{1}{2}{{x}^{3}}$
Here are some important questions for Class 8 Maths. For a deeper understanding of each chapter, please go through the Chapter-wise Important Questions table. This resource will assist you in understanding the key concepts and important questions in each chapter, and prepare effectively for your exams.
How do Class 8 Maths Important Questions Help you with Exams?
These important questions highlight the major themes and ideas from each chapter, ensuring students concentrate on the most critical areas.
The questions are carefully chosen based on previous exam trends, helping students get familiar with the types of questions that are likely to appear in their exams.
Working through these questions deepens students' understanding of the chapters, allowing them to connect with the underlying themes and meanings more effectively.
Consistent practice with these questions trains students to manage their time efficiently during the exam by answering in a well-organised manner.
By regularly practising these essential questions, students build confidence as they become more comfortable with the exam format and answering techniques, improving their overall performance.
The Class 8 Maths Important Questions offer a valuable tool for exam preparation. They help students focus on key themes, understand important concepts, and practice answering exam-oriented questions. By regularly solving these questions, students can improve their comprehension, time management, and overall confidence. This targeted preparation ensures a better grasp of the chapters and enhances their ability to perform well in exams.
Additional Study Materials for Class 8 Maths

FAQs on Important Questions For Class 8 Maths - 2026-27
1. Are these important questions for Class 8 Maths aligned with the latest CBSE syllabus for 2026-27?
Yes, all important questions are meticulously curated to be fully aligned with the latest CBSE syllabus and examination guidelines for the 2026-27 academic session. They cover every chapter prescribed by the NCERT, ensuring your preparation is comprehensive and targeted.
2. How do these important questions help in scoring well in the final exam?
These questions are selected based on their probability of appearing in the exam and their conceptual importance. They help by:
- Focusing on topics with higher marks weightage as per the exam pattern.
- Including frequently asked questions from past papers to reveal trends.
- Providing practice on various question types, from 1-mark objective to 5-mark long-answer questions.
- Building confidence by familiarising you with the actual exam format and difficulty level.
3. What is the best strategy to use these important questions for effective revision?
For maximum benefit, first, thoroughly revise the concepts of a chapter from your textbook. Then, attempt to solve the important questions for that chapter as if you are in a test. Finally, analyse your answers and mistakes to identify your weak areas. This practice helps improve speed, accuracy, and time management skills for the actual exam.
4. Do these important questions include Higher Order Thinking Skills (HOTS) problems?
Yes, this collection includes a balanced mix of question types, including Higher Order Thinking Skills (HOTS) problems. These questions are designed to challenge your conceptual understanding and problem-solving abilities beyond direct formula application, preparing you for the trickier problems in the exam.
5. How does practising these questions offer an advantage over only solving NCERT textbook exercises?
While NCERT exercises build a strong foundation, important questions provide an exam-oriented perspective. They often integrate concepts from different parts of a chapter or multiple chapters, mirroring the complexity of board exam questions. This helps you transition from basic understanding to strategic application of knowledge under exam conditions.
6. Which chapters in Class 8 Maths should I focus on more while using these important questions?
While every chapter is essential, topics like Algebraic Expressions and Identities, Mensuration, Squares and Square Roots, and Comparing Quantities often carry significant weightage. It is advisable to dedicate extra practice to the important questions from these high-value chapters to maximise your score.
7. What are some common mistakes students make in high-weightage topics that these questions help to address?
In chapters like Mensuration, students often confuse formulas for different shapes. In Algebra, sign errors are common. These important questions include problems designed to specifically test these common trap points. By practising them, you can proactively identify and rectify these potential error-prone areas before the exam.
8. Why is it important to practise questions from topics that seem easy, like 'Data Handling' or 'Introduction to Graphs'?
These topics are crucial for developing analytical and interpretation skills. Questions from these chapters often test your ability to read data, draw conclusions, and represent information visually. The important questions ensure you master the application and interpretation aspects of these topics, which are essential for scoring full marks and building a strong foundation for higher classes.