


The number of students in a hostel speaking different languages is given below :
Language Tamil Telugu Malayalam Kannada English Others Number of students 36 12 9 6 5 4
Represent the data in a pie chart.
| Language | Tamil | Telugu | Malayalam | Kannada | English | Others |
| Number of students | 36 | 12 | 9 | 6 | 5 | 4 |
Answer
563.7k+ views
Hint: To draw a pie chart we need to find a central angle for each language. And the central angle is given by $\dfrac{{{\text{number of students speaking that language}}}}{{{\text{total number of students}}}}\times 360$. Using this we need to find the central angle for each language and then draw a circle of any radius and placing the protractor on the horizontal radius we need to mark the central angle and repeat the process for all the languages.
Complete step by step solution:
Here we are given the number of students speaking each language
To draw a pie chart we need to find a central angle for each language
And the central angle is given by $\dfrac{{{\text{number of students speaking that language}}}}{{{\text{total number of students}}}}\times 360$
So the total number of students is given by
$ \Rightarrow 36 + 12 + 9 + 6 + 5 + 4 = 72$
So let's find the central angle for each language
The number of students speaking tamil is 36
$
\Rightarrow \dfrac{{36}}{{72}}\times 360 \\
\Rightarrow \dfrac{1}{2}\times 360 \\
\Rightarrow \dfrac{{360}}{2} = 180 \\
$
Hence the central angle for tamil is ${180^ \circ }$
The number of students speaking telugu is 12
$
\Rightarrow \dfrac{{12}}{{72}}\times 360 \\
\Rightarrow \dfrac{1}{6}\times 360 \\
\Rightarrow \dfrac{{360}}{6} = 60 \\
$
Hence the central angle for telugu is ${60^ \circ }$
The number of students speaking malayalam is 9
$
\Rightarrow \dfrac{9}{{72}}\times 360 \\
\Rightarrow \dfrac{1}{8}\times 360 \\
\Rightarrow \dfrac{{360}}{8} = 45 \\
$
Hence the central angle for malayalam is ${45^ \circ }$
The number of students speaking kannada is 6
$
\Rightarrow \dfrac{6}{{72}}\times 360 \\
\Rightarrow \dfrac{1}{{12}}\times 360 \\
\Rightarrow \dfrac{{360}}{{12}} = 30 \\
$
Hence the central angle for kannada is ${30^ \circ }$
The number of students speaking english is 5
$
\Rightarrow \dfrac{5}{1}\times 5 \\
\Rightarrow 5\times 5 = 25 \\
$
Hence the central angle for english is ${25^ \circ }$
The number of students speaking other language are 4
$
\Rightarrow \dfrac{4}{{72}}\times 360 \\
\Rightarrow \dfrac{1}{{18}}\times 360 \\
\Rightarrow \dfrac{{360}}{{18}} = 20 \\
$
Hence the central angle for other language is ${20^ \circ }$
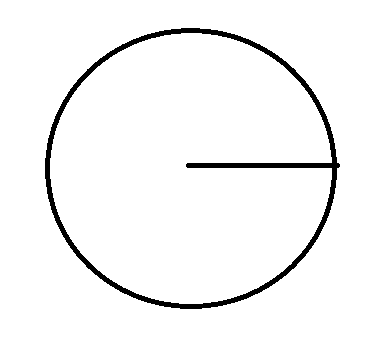
To draw a pie chart we need to draw a circle with any radius.

Draw the horizontal radius
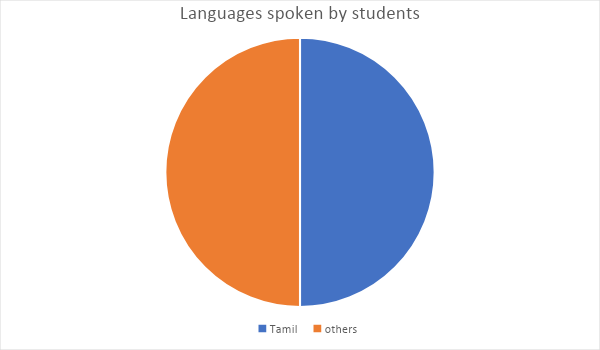
Now place the protractor on the radius and mark the angle for tamil.
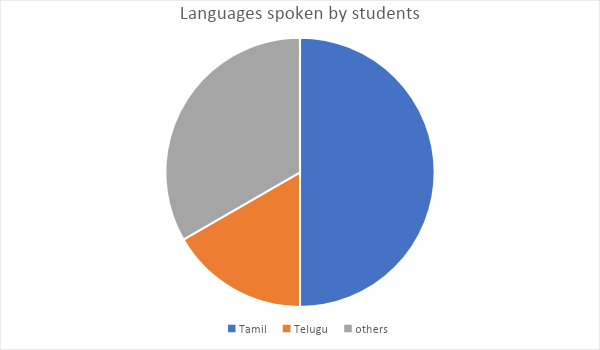
now place the protractor on the line drawn for tamil and mark the angle for telugu.
And we need to repeat this procedure for all the languages.
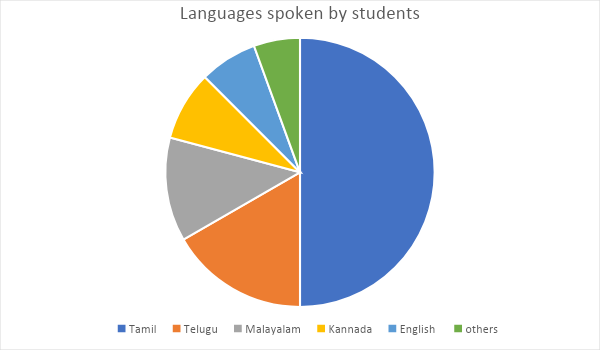
Hence the pie chart is obtained.
Note :
Pie charts are generally used to show percentage or proportional data and usually the percentage represented by each category is provided next to the corresponding slice of pie. Pie charts are good for displaying data for around 6 categories or fewer.
If the data is given in percentage then the central angle is given by $\dfrac{{{\text{percentage value of the component}}}}{{100}}\times 360$.
Complete step by step solution:
Here we are given the number of students speaking each language
To draw a pie chart we need to find a central angle for each language
And the central angle is given by $\dfrac{{{\text{number of students speaking that language}}}}{{{\text{total number of students}}}}\times 360$
So the total number of students is given by
$ \Rightarrow 36 + 12 + 9 + 6 + 5 + 4 = 72$
So let's find the central angle for each language
The number of students speaking tamil is 36
$
\Rightarrow \dfrac{{36}}{{72}}\times 360 \\
\Rightarrow \dfrac{1}{2}\times 360 \\
\Rightarrow \dfrac{{360}}{2} = 180 \\
$
Hence the central angle for tamil is ${180^ \circ }$
The number of students speaking telugu is 12
$
\Rightarrow \dfrac{{12}}{{72}}\times 360 \\
\Rightarrow \dfrac{1}{6}\times 360 \\
\Rightarrow \dfrac{{360}}{6} = 60 \\
$
Hence the central angle for telugu is ${60^ \circ }$
The number of students speaking malayalam is 9
$
\Rightarrow \dfrac{9}{{72}}\times 360 \\
\Rightarrow \dfrac{1}{8}\times 360 \\
\Rightarrow \dfrac{{360}}{8} = 45 \\
$
Hence the central angle for malayalam is ${45^ \circ }$
The number of students speaking kannada is 6
$
\Rightarrow \dfrac{6}{{72}}\times 360 \\
\Rightarrow \dfrac{1}{{12}}\times 360 \\
\Rightarrow \dfrac{{360}}{{12}} = 30 \\
$
Hence the central angle for kannada is ${30^ \circ }$
The number of students speaking english is 5
$
\Rightarrow \dfrac{5}{1}\times 5 \\
\Rightarrow 5\times 5 = 25 \\
$
Hence the central angle for english is ${25^ \circ }$
The number of students speaking other language are 4
$
\Rightarrow \dfrac{4}{{72}}\times 360 \\
\Rightarrow \dfrac{1}{{18}}\times 360 \\
\Rightarrow \dfrac{{360}}{{18}} = 20 \\
$
Hence the central angle for other language is ${20^ \circ }$
To draw a pie chart we need to draw a circle with any radius.
Draw the horizontal radius
Now place the protractor on the radius and mark the angle for tamil.
now place the protractor on the line drawn for tamil and mark the angle for telugu.
And we need to repeat this procedure for all the languages.
Hence the pie chart is obtained.
Note :
Pie charts are generally used to show percentage or proportional data and usually the percentage represented by each category is provided next to the corresponding slice of pie. Pie charts are good for displaying data for around 6 categories or fewer.
If the data is given in percentage then the central angle is given by $\dfrac{{{\text{percentage value of the component}}}}{{100}}\times 360$.
Recently Updated Pages
Basicity of sulphurous acid and sulphuric acid are
Master Class 10 English: Engaging Questions & Answers for Success
Master Class 10 Social Science: Engaging Questions & Answers for Success
Master Class 10 Computer Science: Engaging Questions & Answers for Success
Class 10 Question and Answer - Your Ultimate Solutions Guide
Master Class 10 General Knowledge: Engaging Questions & Answers for Success
Trending doubts
Which country won the ICC Men's ODI World Cup in 2023?
In cricket, how many legal balls are there in a standard over?
Explain the Treaty of Vienna of 1815 class 10 social science CBSE
A boat goes 24 km upstream and 28 km downstream in class 10 maths CBSE
What does "powerplay" mean in limited-overs cricket?
What is the "Powerplay" in T20 cricket?