


The following table shows the area of the land on which different crops were grown.
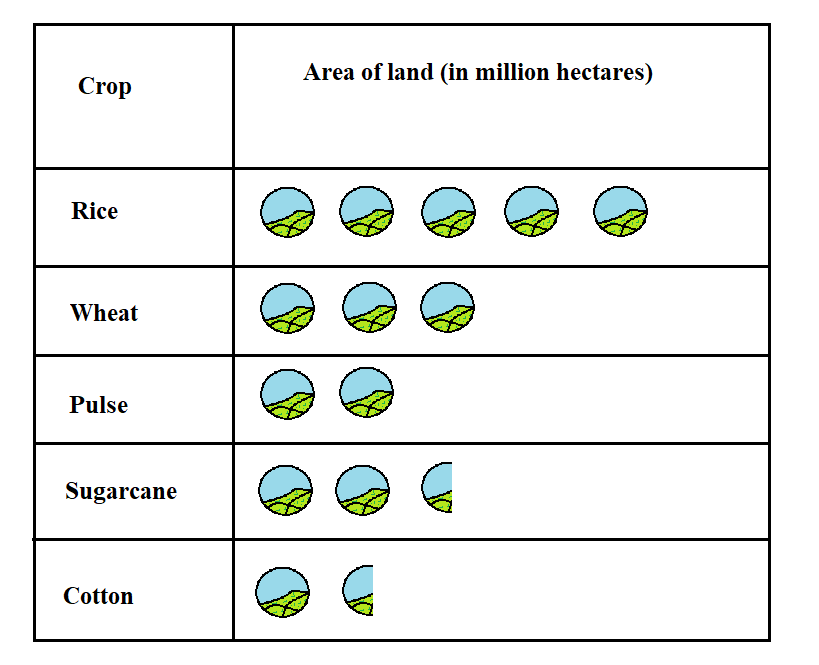
Crop Area of land (in million hectares) Rice 50 Wheat 30 Pulses 20 Sugarcane 25 Cotton 15
Prepare a pictograph by choosing a suitable symbol to represent 10 million hectares.
| Crop | Area of land (in million hectares) |
| Rice | 50 |
| Wheat | 30 |
| Pulses | 20 |
| Sugarcane | 25 |
| Cotton | 15 |
Answer
535.5k+ views
Hint: Here in this question, we have to construct the pictograph. Given the frequency of data of area of the land on which different crops were grown in million hectares, while using any symbols or images that are relevant to the given data we can draw a required pictograph.
Complete step-by-step solution:
In graph theory , a pictograph is a graph that shows numerical information by using picture symbols or icons to represent data sets. The advantage of using a pictograph is that it is easy to read.
Now consider the given table shows the area of the land in million hectares on which different crops were grown.
The symbol or image
The pictograph representation of the area of land on which different crops were grown are:
Note: The represent or reading a pictograph is made extremely easy as well as compare to the other graphs, because Express a large amount of information or data in a simple form, Since they make the use of symbols, pictographs attract attention i.e., it is an attractive way to represent data, Pictographs are easy to read since all the information is available at one glance and since pictographs are universally used they do not require a lot of explanation.
Recently Updated Pages
Master Class 10 Social Science: Engaging Questions & Answers for Success
Master Class 10 Science: Engaging Questions & Answers for Success
Master Class 10 Maths: Engaging Questions & Answers for Success
Master Class 10 General Knowledge: Engaging Questions & Answers for Success
Master Class 10 Computer Science: Engaging Questions & Answers for Success
Class 10 Question and Answer - Your Ultimate Solutions Guide
Trending doubts
What is the full form of PNG A Petrol Natural Gas B class 10 chemistry CBSE
Explain the Treaty of Vienna of 1815 class 10 social science CBSE
In cricket, how many legal balls are there in a standard over?
Why is there a time difference of about 5 hours between class 10 social science CBSE
Who Won 36 Oscar Awards? Record Holder Revealed
What is the median of the first 10 natural numbers class 10 maths CBSE