


The following are the details or the number of students in a class of 30 students present during a week.
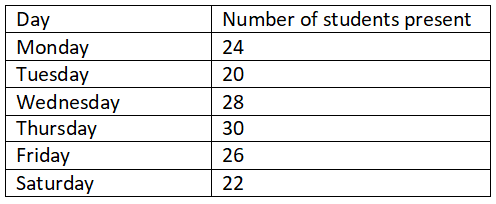
Represent the above data by a pictograph.
Answer
593.7k+ views
Hint: Here we will use the basic concept of the pictograph to represent the data given in the table. As the number of students in the data is too high, we will assume 1 picture equivalent to some number of students. So we will form the pictograph for each day in the form of the pictures which will represent the data.
Complete step-by-step answer:
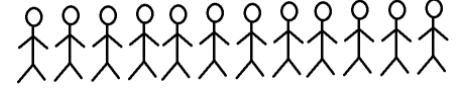
We will assume that this picture
 is equivalent to the two students. The number of students given is even for all the days. So this will make the data representation easy and simple.
Therefore,
 =2 students
So, firstly we will draw the pictograph for the day Monday. As one picture is equal to the two students then there will be 12 pictures for the 24 students. Therefore, we get
Pictograph for the Monday is
Similarly we will find this for all the days and plot it in a table, we get
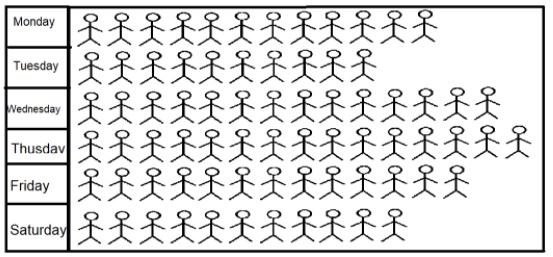
Hence, this is the pictograph for all the days given in the data table.
Note: We should know that the pictograph is the graph in which the data is represented in the forms of the pictures. This is generally used in the earliest form of the representation or writing of data. The picture represents the quantity of the data like we assumed in our answer that the picture is equal to the student. In the large number of data we allot the multiple data to a single picture. It is the simplest form of data representation.
Complete step-by-step answer:
We will assume that this picture
Therefore,
So, firstly we will draw the pictograph for the day Monday. As one picture is equal to the two students then there will be 12 pictures for the 24 students. Therefore, we get
Pictograph for the Monday is
Similarly we will find this for all the days and plot it in a table, we get
Hence, this is the pictograph for all the days given in the data table.
Note: We should know that the pictograph is the graph in which the data is represented in the forms of the pictures. This is generally used in the earliest form of the representation or writing of data. The picture represents the quantity of the data like we assumed in our answer that the picture is equal to the student. In the large number of data we allot the multiple data to a single picture. It is the simplest form of data representation.
Recently Updated Pages
Three beakers labelled as A B and C each containing 25 mL of water were taken A small amount of NaOH anhydrous CuSO4 and NaCl were added to the beakers A B and C respectively It was observed that there was an increase in the temperature of the solutions contained in beakers A and B whereas in case of beaker C the temperature of the solution falls Which one of the following statements isarecorrect i In beakers A and B exothermic process has occurred ii In beakers A and B endothermic process has occurred iii In beaker C exothermic process has occurred iv In beaker C endothermic process has occurred
Master Class 9 Social Science: Engaging Questions & Answers for Success
Master Class 9 Science: Engaging Questions & Answers for Success
Master Class 9 Maths: Engaging Questions & Answers for Success
Master Class 9 General Knowledge: Engaging Questions & Answers for Success
Class 9 Question and Answer - Your Ultimate Solutions Guide
Three beakers labelled as A B and C each containing 25 mL of water were taken A small amount of NaOH anhydrous CuSO4 and NaCl were added to the beakers A B and C respectively It was observed that there was an increase in the temperature of the solutions contained in beakers A and B whereas in case of beaker C the temperature of the solution falls Which one of the following statements isarecorrect i In beakers A and B exothermic process has occurred ii In beakers A and B endothermic process has occurred iii In beaker C exothermic process has occurred iv In beaker C endothermic process has occurred
Master Class 9 Social Science: Engaging Questions & Answers for Success
Master Class 9 Science: Engaging Questions & Answers for Success
Trending doubts
Find the sum of series 1 + 2 + 3 + 4 + 5 + + 100 class 9 maths CBSE
Fill the blanks with the suitable prepositions 1 The class 9 english CBSE
Difference Between Plant Cell and Animal Cell
What is pollution? How many types of pollution? Define it
Name 10 Living and Non living things class 9 biology CBSE
Which are the Top 10 Largest States of India?