


How do you graph \[y=-{{x}^{2}}+5\]?
Answer
563.4k+ views
Hint: To solve this question of finding the graph of a function \[y=-{{x}^{2}}+5\], we will be using the basic concept, that is we will find few points on the graph which would satisfy the given equation. We must be having knowledge of the concept of parabola and its applications and properties. By using the general solution technique of assigning different values to the parameters of the given question that is the x and y in the equation we can get the graph.
Complete step-by-step answer:
We will start by finding some points that would lie on the graph of the function. It will help us plot the graph which is asked in the question.
Let us take the value of \[x=0\]. By substituting in given function, we get the value of the y as
\[\Rightarrow y=5\]
In the same way we must also find another reading to get the entire idea of how the graph is going to be, so that we can plot it in a graph.
Let us take the value of \[x=1\] . By substitution, we are able to get the value of y as
\[\Rightarrow y=4\]
So by the basic technique of assigning the different values to x we have found some values of y. Now, with the help of the points we determine the graph as follows,
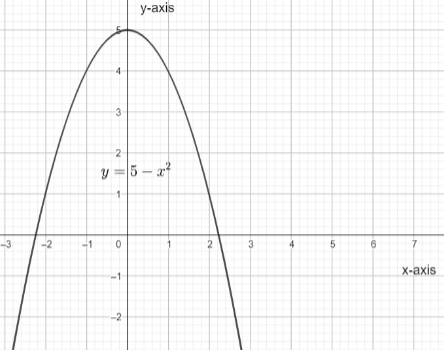
Note: The problems of this sort can be done by having the basic knowledge in plotting of a graph by finding the different points on graph using assigning different values and also it can be done by another means of way by having the concept of parabola .from comparing the given equation \[y=-{{x}^{2}}+5\]to the standard form of the parabola that is \[y=a{{\left( x-h \right)}^{2}}+k\]where h,k are vertices .By comparing we get\[\Rightarrow a=-1,h=0,k=5\] and a is negative so parabola will be inverted.
Complete step-by-step answer:
We will start by finding some points that would lie on the graph of the function. It will help us plot the graph which is asked in the question.
Let us take the value of \[x=0\]. By substituting in given function, we get the value of the y as
\[\Rightarrow y=5\]
In the same way we must also find another reading to get the entire idea of how the graph is going to be, so that we can plot it in a graph.
Let us take the value of \[x=1\] . By substitution, we are able to get the value of y as
\[\Rightarrow y=4\]
So by the basic technique of assigning the different values to x we have found some values of y. Now, with the help of the points we determine the graph as follows,
Note: The problems of this sort can be done by having the basic knowledge in plotting of a graph by finding the different points on graph using assigning different values and also it can be done by another means of way by having the concept of parabola .from comparing the given equation \[y=-{{x}^{2}}+5\]to the standard form of the parabola that is \[y=a{{\left( x-h \right)}^{2}}+k\]where h,k are vertices .By comparing we get\[\Rightarrow a=-1,h=0,k=5\] and a is negative so parabola will be inverted.
Recently Updated Pages
Basicity of sulphurous acid and sulphuric acid are
Master Class 10 English: Engaging Questions & Answers for Success
Master Class 10 Social Science: Engaging Questions & Answers for Success
Master Class 10 Computer Science: Engaging Questions & Answers for Success
Class 10 Question and Answer - Your Ultimate Solutions Guide
Master Class 10 General Knowledge: Engaging Questions & Answers for Success
Trending doubts
Which country won the ICC Men's ODI World Cup in 2023?
In cricket, how many legal balls are there in a standard over?
Explain the Treaty of Vienna of 1815 class 10 social science CBSE
A boat goes 24 km upstream and 28 km downstream in class 10 maths CBSE
What does "powerplay" mean in limited-overs cricket?
What is the "Powerplay" in T20 cricket?