


How do you graph the equation by plotting points $3x+5y=12$ ?
Answer
573.9k+ views
Hint: To graph the above equation $3x+5y=12$, we are going to first put x as 0 in this equation and then solve the equation to find the value of y. Let us assume this point as A. Now, we are going to put the value of y as 0 in the above equation and then solve the equation to find the value of x. And mark this point as B. Now, plot these points A and B on the graph and join these two points to get the straight line.
Complete step-by-step answer:
The equation given in the above problem which we have to plot is as follows:
$3x+5y=12$
Now, let us put the value of x as 0 in the above equation we get,
$\begin{align}
& \Rightarrow 3\left( 0 \right)+5y=12 \\
& \Rightarrow 0+5y=12 \\
& \Rightarrow 5y=12 \\
\end{align}$
Dividing 5 on both the sides of the above equation we get,
$\begin{align}
& \Rightarrow \dfrac{5y}{5}=\dfrac{12}{5} \\
& \Rightarrow y=\dfrac{12}{5} \\
\end{align}$
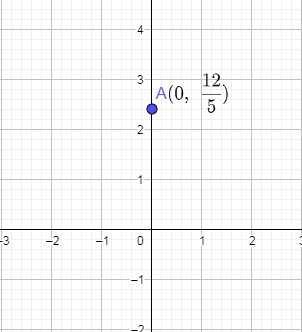
Hence, from the above, we have got one point which we are going to plot on the graph as $\left( 0,\dfrac{12}{5} \right)$. Let us call this point as A. Now, we are plotting this point A on the graph.
Now, let us substitute y as 0 in the above equation we get,
$\begin{align}
& \Rightarrow 3x+5\left( 0 \right)=12 \\
& \Rightarrow 3x+0=12 \\
\end{align}$
Dividing 3 on both the sides of the above equation we get,
$\begin{align}
& \Rightarrow \dfrac{3x}{3}=\dfrac{12}{3} \\
& \Rightarrow x=4 \\
\end{align}$
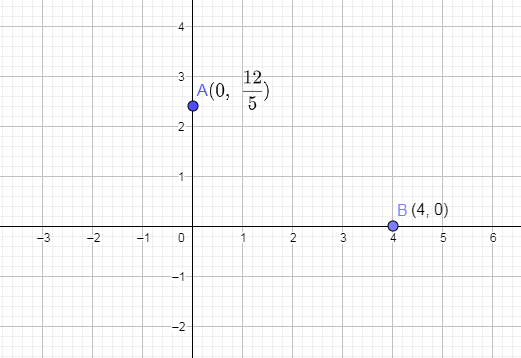
From the above, we got the second point as $\left( 4,0 \right)$ and let us denote this point as B. Now, we are going to plot this point B (4, 0) on the graph and we get,
Now, we are going to join these two points A and B to draw the straight line equation.
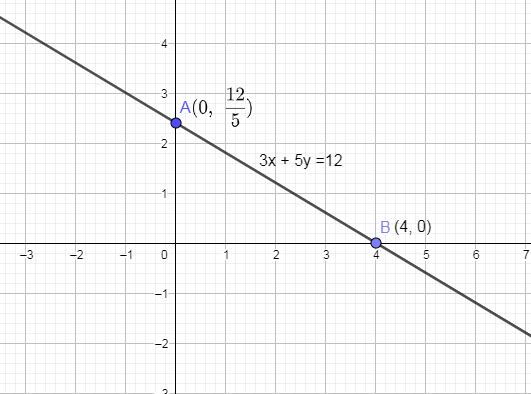
Hence, we have drawn the straight line which is having equation $3x+5y=12$.
Note: The information you can get from the above graph is the x intercept which is the point on the x axis where the straight line is cutting the x axis and y intercept is the point on the y axis where the equation of a straight line is cutting.
So, in the graph, we have drawn above i.e.:

Point B is the x intercept and point A is the y intercept.
Complete step-by-step answer:
The equation given in the above problem which we have to plot is as follows:
$3x+5y=12$
Now, let us put the value of x as 0 in the above equation we get,
$\begin{align}
& \Rightarrow 3\left( 0 \right)+5y=12 \\
& \Rightarrow 0+5y=12 \\
& \Rightarrow 5y=12 \\
\end{align}$
Dividing 5 on both the sides of the above equation we get,
$\begin{align}
& \Rightarrow \dfrac{5y}{5}=\dfrac{12}{5} \\
& \Rightarrow y=\dfrac{12}{5} \\
\end{align}$
Hence, from the above, we have got one point which we are going to plot on the graph as $\left( 0,\dfrac{12}{5} \right)$. Let us call this point as A. Now, we are plotting this point A on the graph.
Now, let us substitute y as 0 in the above equation we get,
$\begin{align}
& \Rightarrow 3x+5\left( 0 \right)=12 \\
& \Rightarrow 3x+0=12 \\
\end{align}$
Dividing 3 on both the sides of the above equation we get,
$\begin{align}
& \Rightarrow \dfrac{3x}{3}=\dfrac{12}{3} \\
& \Rightarrow x=4 \\
\end{align}$
From the above, we got the second point as $\left( 4,0 \right)$ and let us denote this point as B. Now, we are going to plot this point B (4, 0) on the graph and we get,
Now, we are going to join these two points A and B to draw the straight line equation.
Hence, we have drawn the straight line which is having equation $3x+5y=12$.
Note: The information you can get from the above graph is the x intercept which is the point on the x axis where the straight line is cutting the x axis and y intercept is the point on the y axis where the equation of a straight line is cutting.
So, in the graph, we have drawn above i.e.:
Point B is the x intercept and point A is the y intercept.
Recently Updated Pages
Three beakers labelled as A B and C each containing 25 mL of water were taken A small amount of NaOH anhydrous CuSO4 and NaCl were added to the beakers A B and C respectively It was observed that there was an increase in the temperature of the solutions contained in beakers A and B whereas in case of beaker C the temperature of the solution falls Which one of the following statements isarecorrect i In beakers A and B exothermic process has occurred ii In beakers A and B endothermic process has occurred iii In beaker C exothermic process has occurred iv In beaker C endothermic process has occurred
Master Class 10 Social Science: Engaging Questions & Answers for Success
Master Class 10 Science: Engaging Questions & Answers for Success
Master Class 10 Maths: Engaging Questions & Answers for Success
Master Class 10 General Knowledge: Engaging Questions & Answers for Success
Master Class 10 Computer Science: Engaging Questions & Answers for Success
Three beakers labelled as A B and C each containing 25 mL of water were taken A small amount of NaOH anhydrous CuSO4 and NaCl were added to the beakers A B and C respectively It was observed that there was an increase in the temperature of the solutions contained in beakers A and B whereas in case of beaker C the temperature of the solution falls Which one of the following statements isarecorrect i In beakers A and B exothermic process has occurred ii In beakers A and B endothermic process has occurred iii In beaker C exothermic process has occurred iv In beaker C endothermic process has occurred
Master Class 10 Social Science: Engaging Questions & Answers for Success
Master Class 10 Science: Engaging Questions & Answers for Success
Trending doubts
Explain the Treaty of Vienna of 1815 class 10 social science CBSE
In cricket, what is the term for a bowler taking five wickets in an innings?
Who Won 36 Oscar Awards? Record Holder Revealed
What is the name of Japan Parliament?
What is the median of the first 10 natural numbers class 10 maths CBSE
Why is it 530 pm in india when it is 1200 afternoon class 10 social science CBSE