


Given below is a double bar graph:
Read the double bar graph carefully and answer the following question:
What is the information given by the double bar graph?
Answer
547.2k+ views
Hint: Double bar graph is a chart or a graphical representation of data, quantities or numbers using bars or strips. The height of the bars represent their proportional values. A double bar graph to display two sets of data on the same graph. It compares one set of data to another
Complete step-by-step solution:
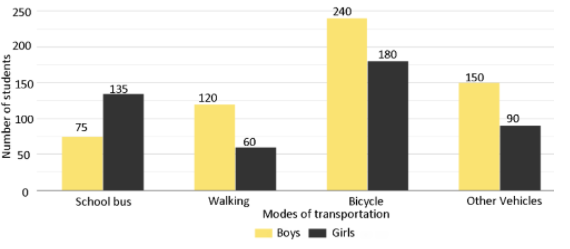
We use a double bar graph to display two sets of data on the same graph. The information in a double bar graph is related, and it compares one set of data to another. According to the definition of double bar graph, we can say that in the given double bar graph two sets of data, boys and girls, are compared based on the modes of transportation.
Therefore, the given bar graph depicts the number of boys and girls that adopt different modes of transportation to reach the school.
Note: Students may get confused with single bar graph and double bar graph. In a single bar graph or simply bar graph, we only represent one data against their values. Double bar graph is a type of bar graph. In the bar graph, we can plot bars vertically or horizontally. Vertical bar graph is also known as column graph.
Complete step-by-step solution:
We use a double bar graph to display two sets of data on the same graph. The information in a double bar graph is related, and it compares one set of data to another. According to the definition of double bar graph, we can say that in the given double bar graph two sets of data, boys and girls, are compared based on the modes of transportation.
Therefore, the given bar graph depicts the number of boys and girls that adopt different modes of transportation to reach the school.
Note: Students may get confused with single bar graph and double bar graph. In a single bar graph or simply bar graph, we only represent one data against their values. Double bar graph is a type of bar graph. In the bar graph, we can plot bars vertically or horizontally. Vertical bar graph is also known as column graph.
Recently Updated Pages
Master Class 10 English: Engaging Questions & Answers for Success
Master Class 10 Social Science: Engaging Questions & Answers for Success
Master Class 10 Computer Science: Engaging Questions & Answers for Success
Class 10 Question and Answer - Your Ultimate Solutions Guide
Master Class 10 General Knowledge: Engaging Questions & Answers for Success
Master Class 10 Maths: Engaging Questions & Answers for Success
Trending doubts
What is the median of the first 10 natural numbers class 10 maths CBSE
Fill the blanks with proper collective nouns 1 A of class 10 english CBSE
Choose the feminine form of the given noun Fox AFoxess class 10 english CBSE
Find the mode of 10 12 11 10 15 20 19 21 11 9 10 class 10 maths CBSE
Why did Frederic Sorrieu present utopian vision in class 10 social science CBSE
If the zeroes of the polynomial x2 + 4x + 2a are alpha class 10 maths CBSE