


For x greater than or equal to zero and less than or equal to 2 pi, sin x and cos x are both decreasing on the intervals:
$
{\text{A}}{\text{. }}\left( {0,\dfrac{\pi }{2}} \right) \\
{\text{B}}{\text{. }}\left( {\dfrac{\pi }{2},\pi } \right) \\
{\text{C}}{\text{. }}\left( {\pi ,\dfrac{{3\pi }}{2}} \right) \\
{\text{D}}{\text{. }}\left( {\dfrac{{3\pi }}{2},2\pi } \right) \\
$
Answer
643.2k+ views
Hint: In order to find out the interval in which both sin x and cos x graphs are declining in the range x = [0, 2π], we first plot the graphs of sin x and cos x and study them in the given range. Then we visually identify in which region both the graphs are decreasing and write down that interval which is the answer.
Complete step-by-step answer:
Given Data,
Range of x = [0, 2π]
Graphs of sin x and cos x.
In order to study the graph of sin x and cos x we plot them on the XY – axis within the limits of x = [0, 2π]
It is shown as follows:
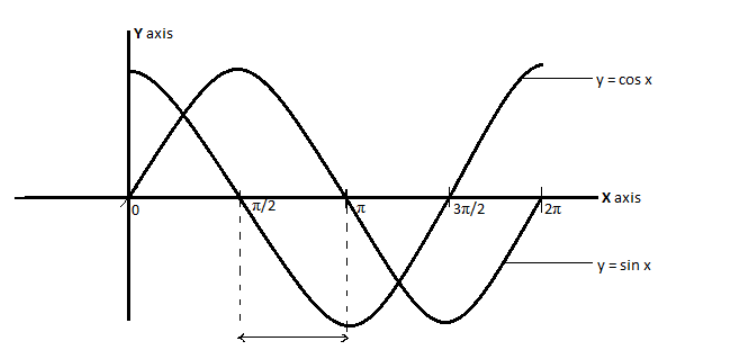
The graphs of trigonometric functions sin x and cos x look as per the given figure. We can verify the correctness of the graph obtained by substituting the values of x in the function it satisfies for every single value of x in the range [0, 2π].
From the figure, we can say that in between the interval starting from π/2 till π, both the graphs of sin x and cos x appear to be coming closer than zero, i.e. their value is decreasing.
In all the other intervals of them in between [0, 2π] they are either increasing or only one of them is decreasing.
Hence, for x greater than or equal to zero and less than or equal to 2 pi, sin x and cos x are both decreasing on the intervals $\left( {\dfrac{\pi }{2},\pi } \right)$.
Option B is the correct answer.
Note:In order to solve this type of problems the key is to know the graph equations of trigonometric functions, sin x and cos x. If we know the general form of the curve of sin x and cos x we can compute the graph for a specific range of ‘x’ by substituting it in the trigonometric function.
The graphs of sin and cos trigonometric functions are defined for all real numbers and continuous for all the values of x.
Sin and cos functions are also periodic, i.e. the distance between two consecutive maxima in a sine or a cos function graph is regular throughout its entire course and is equal to 2π.
Complete step-by-step answer:
Given Data,
Range of x = [0, 2π]
Graphs of sin x and cos x.
In order to study the graph of sin x and cos x we plot them on the XY – axis within the limits of x = [0, 2π]
It is shown as follows:
The graphs of trigonometric functions sin x and cos x look as per the given figure. We can verify the correctness of the graph obtained by substituting the values of x in the function it satisfies for every single value of x in the range [0, 2π].
From the figure, we can say that in between the interval starting from π/2 till π, both the graphs of sin x and cos x appear to be coming closer than zero, i.e. their value is decreasing.
In all the other intervals of them in between [0, 2π] they are either increasing or only one of them is decreasing.
Hence, for x greater than or equal to zero and less than or equal to 2 pi, sin x and cos x are both decreasing on the intervals $\left( {\dfrac{\pi }{2},\pi } \right)$.
Option B is the correct answer.
Note:In order to solve this type of problems the key is to know the graph equations of trigonometric functions, sin x and cos x. If we know the general form of the curve of sin x and cos x we can compute the graph for a specific range of ‘x’ by substituting it in the trigonometric function.
The graphs of sin and cos trigonometric functions are defined for all real numbers and continuous for all the values of x.
Sin and cos functions are also periodic, i.e. the distance between two consecutive maxima in a sine or a cos function graph is regular throughout its entire course and is equal to 2π.
Recently Updated Pages
Basicity of sulphurous acid and sulphuric acid are
Master Class 10 Computer Science: Engaging Questions & Answers for Success
Master Class 10 Social Science: Engaging Questions & Answers for Success
Master Class 10 Science: Engaging Questions & Answers for Success
Class 10 Question and Answer - Your Ultimate Solutions Guide
Master Class 10 Maths: Engaging Questions & Answers for Success
Trending doubts
What is the Total Duration of Football Match?
Explain the Treaty of Vienna of 1815 class 10 social science CBSE
In football, which nation is called "La Roja"?
Why is there a time difference of about 5 hours between class 10 social science CBSE
10 examples of evaporation in daily life with explanations
What is the full form of POSCO class 10 social science CBSE