


At the start of a new movie at a theater there are 250 people in it. However, $10\% $ of the people walkout of the theater within15 minutes of the movie starting. If another $10\% $ leave in the 15 minutes and this rate continues for the duration of the movie, which of the following graphs appropriately models the number of people in the theater during the movie?

Answer
593.1k+ views
Hint: This is a very interesting real life application of compounded interest value. Here we can see that one graph is a straight line, but the other three are the exponential curves. So, we have to make an equation by which we can find the relationship between time and number of people leaving the theater gradually. By using the suitable formula of compound interest with negative value of interest, we can find the solution.
Complete step-by-step answer:
Since, $10\% $ of the people walk out of the theater within the first $15$ minutes of the movie starting. Then, in the next 15 minutes $10\% $ of the remaining people are leaving the theater. This process goes on.
It is obvious that during the next slot 10% of the remaining people have to be computed, which 10% of its previous slot was already. This behavior is similar to the computation of the compound interest on the initial principal amount.
So, we have to apply the formula of compound interest here, with the negative rate of interest. It means, we have
$A = P{\left( {1 - \dfrac{{10}}{n}} \right)^{nt}}$
Where P is the initial number of people, and P will be the number of people in the next slot. Also, n is the number of repetitions and t as unit time.
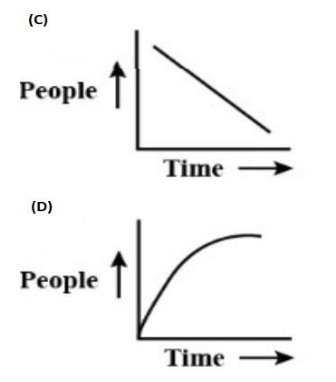
We can observe that the above equation is having exponents’ value term. So, it will show the exponentially decreasing curve. This behavior is perfectly visible in option A curve.
Curve in option B is not suitable, as it is showing increasing slope with the time, which is not applicable in our given problem. The Curve in C option is straight line, so not applicable here. And the curve in option D is an exponential curve with growth nature, which is not applicable too.
Option A is the correct answer.
Note: Always visualize the given problem carefully and correlate it with suitable equations and hence related curves. Knowledge of the equations with suitable curve representation is must for solving such types of problems. Proper analogy between situations in the question with mathematical concepts will definitely help for getting a solution.
Complete step-by-step answer:
Since, $10\% $ of the people walk out of the theater within the first $15$ minutes of the movie starting. Then, in the next 15 minutes $10\% $ of the remaining people are leaving the theater. This process goes on.
It is obvious that during the next slot 10% of the remaining people have to be computed, which 10% of its previous slot was already. This behavior is similar to the computation of the compound interest on the initial principal amount.
So, we have to apply the formula of compound interest here, with the negative rate of interest. It means, we have
$A = P{\left( {1 - \dfrac{{10}}{n}} \right)^{nt}}$
Where P is the initial number of people, and P will be the number of people in the next slot. Also, n is the number of repetitions and t as unit time.
We can observe that the above equation is having exponents’ value term. So, it will show the exponentially decreasing curve. This behavior is perfectly visible in option A curve.
Curve in option B is not suitable, as it is showing increasing slope with the time, which is not applicable in our given problem. The Curve in C option is straight line, so not applicable here. And the curve in option D is an exponential curve with growth nature, which is not applicable too.
Option A is the correct answer.
Note: Always visualize the given problem carefully and correlate it with suitable equations and hence related curves. Knowledge of the equations with suitable curve representation is must for solving such types of problems. Proper analogy between situations in the question with mathematical concepts will definitely help for getting a solution.
Recently Updated Pages
Basicity of sulphurous acid and sulphuric acid are
Master Class 10 English: Engaging Questions & Answers for Success
Master Class 10 Social Science: Engaging Questions & Answers for Success
Master Class 10 Computer Science: Engaging Questions & Answers for Success
Class 10 Question and Answer - Your Ultimate Solutions Guide
Master Class 10 General Knowledge: Engaging Questions & Answers for Success
Trending doubts
Which country won the ICC Men's ODI World Cup in 2023?
In cricket, how many legal balls are there in a standard over?
Explain the Treaty of Vienna of 1815 class 10 social science CBSE
A boat goes 24 km upstream and 28 km downstream in class 10 maths CBSE
What does "powerplay" mean in limited-overs cricket?
What is the "Powerplay" in T20 cricket?