


What Is a Pictograph Definition Steps and Solved Examples
Did you know that there is a way to make numbers more interesting? Pictographs can be used primarily for making early learners associate objects with numbers. They help in representing the data visually interesting and easy to understand. They can be useful for representing a large amount of data and solving pictograph questions to help in visually formatting statistical data. In Mathematics, a pictograph, also called a pictogram, is the pictorial representation of data using images, icons, or symbols. Examples of pictograms are also covered here. Pictographs are one of the simplest ways to represent data.
What is a Pictograph for Class 3?
Pictographs are a way to represent data using images. Each image of a pictograph represents a certain number of things. In other words, a pictograph uses images and symbols to convey information about the data provided.
Key of a Pictograph
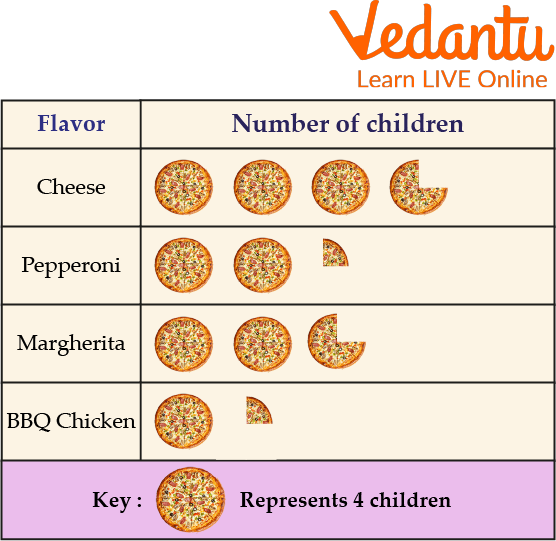
We use a key to indicate the value of the symbol in a pictograph. In the picture below, the key is a pizza icon representing 4 children.
Pictograph Questions
Advantages of the Pictograph
Pictographs are widely used in Mathematics. There are several advantages to using pictographs in Mathematics. These are some of the advantages.
They can be used primarily to get early learners to associate objects with numbers.
They help to visually format the statistics.
They make data visually interesting and easy to understand.
Representing data pictographically can be useful for representing large amounts of data.
Solved Examples of Pictograph
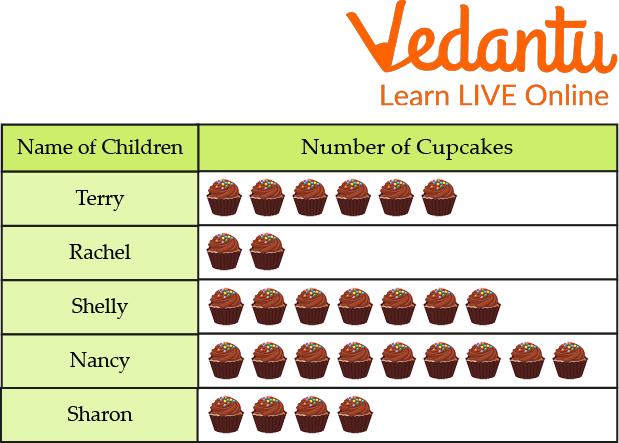
1. The number of cupcakes given to 5 children is shown below. Construct a Pictograph from the given data. Also, label its parts.
1 Cupcake
Children name Terry Rachel Shelly Nancy Sharon
Number of cupcakes 6 3 7 9 4
Answer:
Pictograph with Questions and Answers
The above examples of pictographs will help us to understand how to represent the data using pictographs.
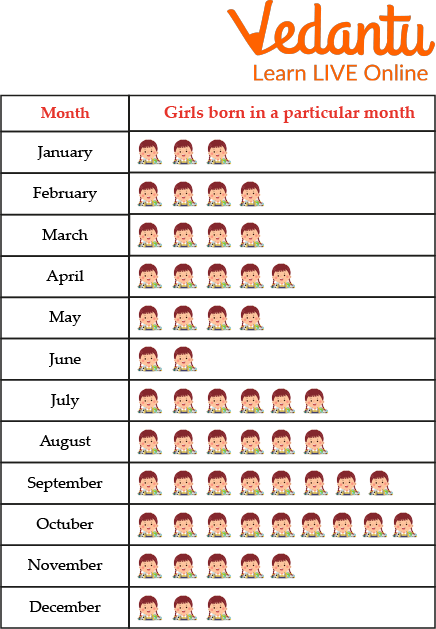
2. The pictograph represents different months of the year and the girls of a class born in a certain month:
Pictograph with Questions and Answers
Answer the following questions according to the given pictograph:
(i) How many daughters were born in the months of (a) September, and (b) October?
Ans. (a) In September 8 girls were born
(b) In October, 9 girls were born.
(ii) How many girls were born in June?
Ans. In June only 2 girls were born.
(iii) In what month was (a) the maximum number and (b) the minimum number of children born?
Ans. (a) The maximum number of girls born in October (9 girls)
(b) The minimum number of girls born in June (2 girls)
(iv) Find the total number of girls in the class.
Ans. The total number of girls in the class was 3 + 4 + 4 + 5 + 4 + 2 + 6 + 6 + 8 + 9 + 5 + 3 = 59
(v) What is the difference between the number of girls born in October and June?
Ans. The difference between the number of girls born in October and June = 9 – 2 = 7
Pictograph Examples for Grade 4
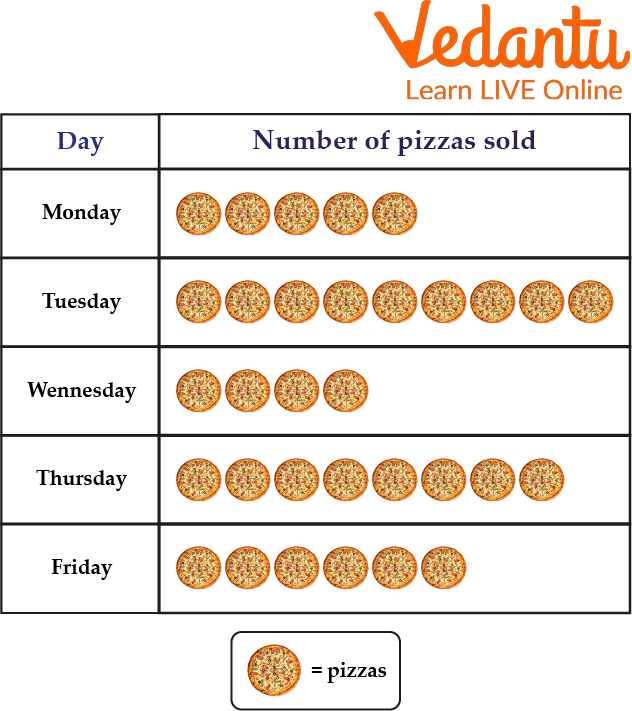
1. Jake recorded the number of pizzas sold for five days.
Read the table and answer the questions:
Pictograph Examples for Grade 4
Q1. How many pizzas did he sell on Thursday?
Ans. 8 x 5 = 40
Q2. Which day sold fewer pizzas?
Ans. Wednesday
Q3. Which day sold more pizzas?
Ans. Tuesday
Q4. What day did he sell 25 pizzas?
Ans. Monday
Q5. How many pizzas were sold on Monday and Wednesday?
Ans. 9 x 5= 45
Q6. How many fewer pizzas were sold on Friday than Thursday?
Ans. Friday 6 x5 = 30
Thursday 8 x 5 = 40
Fewer pizzas were 10, i.e. 40 - 30 = 10
2. Number of illiterate children in 5 small towns, Melrose, Marengo, Midway, Parral, and Rushville are given. See the below graphic image or pictograph to answer questions.
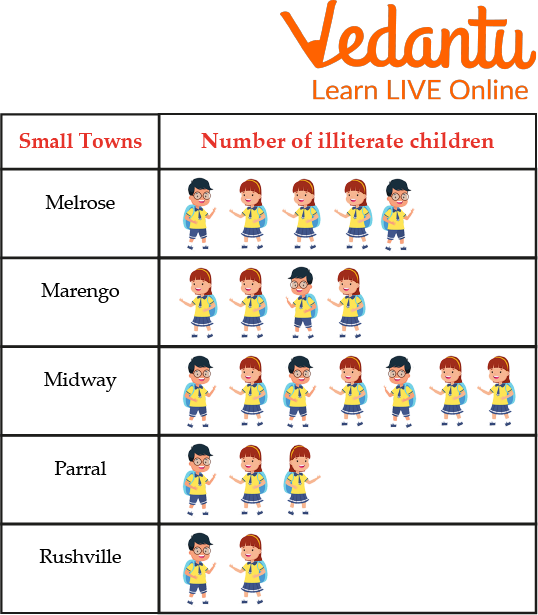
Pictograph Examples for Grade 4
Q1. Find the number of illiterate children in different small towns.
Ans. Melrose - 5, Marengo - 4, Midway - 7, Parral - 3 and Rushville - 2
Total number of illiterates = 21
Q2. Which city has the majority of illiterate children?
Ans. Midway
Practice Problems of Pictograph with Questions and Answers
1. The Pictograph below shows the sales of bouquets on 4 different days in a week.
From the Pictograph, answer the following questions:
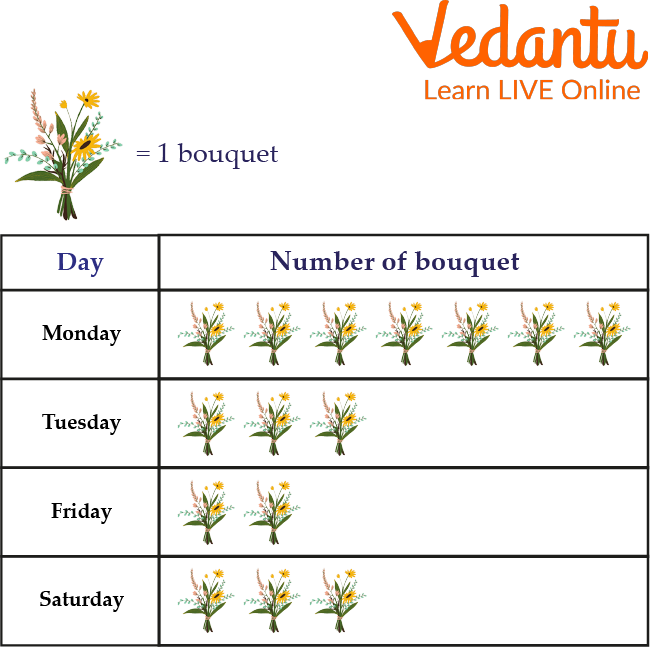
Example of Pictogram
(i) What day of the week were the flower bouquets sold the most?
(ii) On what day did the sales go down?
(iii) How many flower bouquets were sold together on Monday and Saturday?
(iv) How many flower bouquets were sold together on Tuesday and Friday?
(v) How many flower bouquets were sold in total?
Answer:
Monday
Friday
10
5
15
2. The chart below shows the names of shirts ordered in each size in one week.
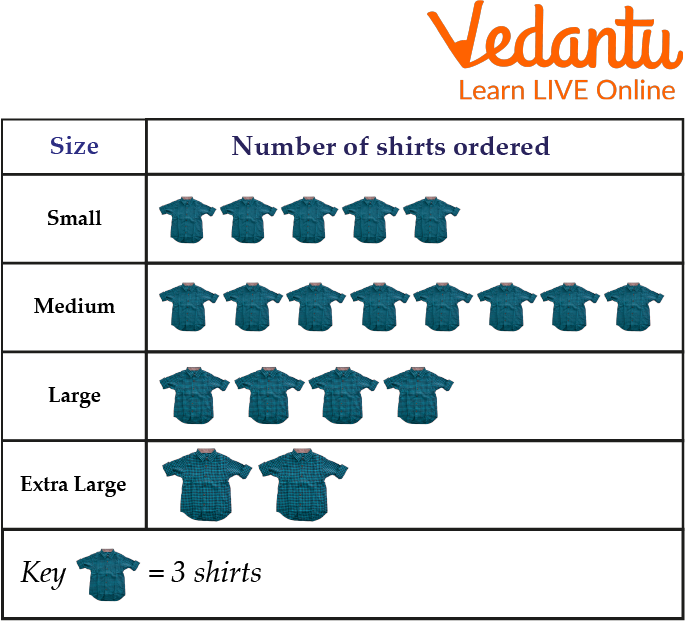
Example of Pictogram
What size of shirts were ordered for 15 (exactly) shirts?
Small
Medium
tall
Very large
Answer: Small
3. The following Pictograph indicates the number of students who use the different modes of transport to get to school.
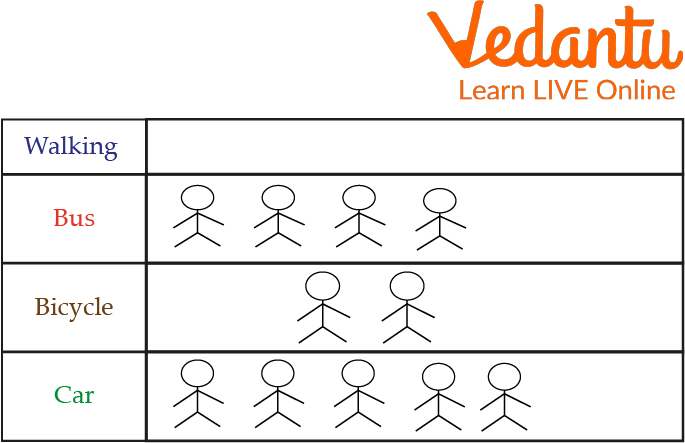
Example of Pictogram
a) How many students go to school by car?
b) If the total number of students participating in the survey is 56, how many symbols should be drawn for students who walk to school?
c) What is the percentage of students cycling to school?
Answer:
a) 20 students
b) 3 symbols
c) 14.29 %
Summary
So in this article, we learnt about pictographs for Class 3, what they are and how they are used to make numbers more fun and help children to develop a better understanding of them because of the representation. We further learnt about pictographs with questions and answers. A key is used to indicate the value of the symbol and some important notes we should keep in mind when we solve pictograph questions. We learnt about its advantages that it makes data visually appealing and hence gives a better understanding of objects for early learners. Some solved pictograph examples are also discussed here.
FAQs on Understanding Pictographs in Data Handling
1. What is a pictograph in maths?
A pictograph is a type of data representation that uses pictures or symbols to show numerical information. In a pictograph, each picture stands for a specific number of items, making data easy to understand visually.
- Each symbol represents a fixed number (e.g., 1 picture = 5 items).
- A key explains what each symbol stands for.
- It is commonly used in primary-level data handling.
2. How do you read a pictograph?
To read a pictograph, first check the key and then multiply the number of symbols by the value each symbol represents.
- Step 1: Look at the title of the pictograph.
- Step 2: Read the key (e.g., 1 symbol = 10 students).
- Step 3: Count the symbols in each category.
- Step 4: Multiply symbols × value of one symbol.
3. How do you make a pictograph step by step?
To make a pictograph, collect data, choose a symbol, assign a key, and draw the symbols according to the data.
- Step 1: Collect and organize data in a table.
- Step 2: Choose a simple picture or symbol.
- Step 3: Decide the key (e.g., 1 symbol = 2 items).
- Step 4: Draw the required number of symbols for each category.
- Step 5: Add a clear title and key.
4. What is the key in a pictograph?
The key in a pictograph tells how many items each symbol represents. Without the key, the pictograph cannot be correctly interpreted.
- It shows the numerical value of one picture.
- Example: 1 book symbol = 4 books.
- If 5 symbols are shown, total books = 5 × 4 = 20 books.
5. Can you give an example of a pictograph question with solution?
A pictograph question can be solved by multiplying the number of symbols by the value given in the key.
- Key: 1 flower = 3 flowers.
- Number of flower symbols shown = 6.
6. What is the difference between a pictograph and a bar graph?
The main difference is that a pictograph uses pictures to represent data, while a bar graph uses rectangular bars.
- Pictograph: Visual symbols with a key.
- Bar graph: Bars of equal width with numerical scale.
- Pictographs are simpler and used for basic data handling.
- Bar graphs are more precise for large data sets.
7. Why are pictographs used in data handling?
Pictographs are used in data handling because they present information in a simple and visually appealing way.
- They are easy for children to understand.
- They quickly show comparisons between categories.
- They make large numbers easier to interpret.
8. What are the advantages and disadvantages of pictographs?
The main advantage of a pictograph is simplicity, while the main disadvantage is limited accuracy for complex data.
- Advantages:
- Easy to read and interpret.
- Visually attractive.
- Good for small data sets.
- Disadvantages:
- Not suitable for very large numbers.
- Can be confusing if the key is unclear.
- Less precise than bar graphs.
9. How do you solve word problems based on pictographs?
To solve word problems on a pictograph, interpret the key and perform basic arithmetic like multiplication or addition.
- Step 1: Read the question carefully.
- Step 2: Identify the value of one symbol from the key.
- Step 3: Count the symbols in the required category.
- Step 4: Multiply or add as needed.
10. What should you remember while drawing a pictograph?
While drawing a pictograph, always choose a suitable key and keep the symbols consistent.
- Use equal-sized symbols.
- Clearly mention the key.
- Add a proper title.
- Ensure symbols match the numerical data correctly.