


How to Use the Bar Model Method with Solved Word Problems
Introduction to Bar Model
A bar model is a pictorial representation of Mathematics problems. The bar model is popularised by the Singapore teaching model and is now being increasingly used in the United Kingdom. Jerome Bruner in the 1960s introduced that people learn in three stages, namely concrete, pictorial, and abstract. The bar model is a way to support students with the middle stage, i.e., pictorial. Read below to know more about bar models.
What is a Bar Model?
Bar model, also known as tape diagram in Japan and strip diagram in the United States, is used throughout the world to help students visualise Maths problems. The main purpose of the bar model is to simply represent Mathematical problems, especially which are quite difficult to solve without visualising it first. There are several variations of the bar model, but all follow the same principles as discussed below:
Bar models are designed in a specific way, using rectangles to represent known and unknown amounts.
Bar models are designed to gather all the relevant information from a problem to examine any facts presented in the questions. This helps children to start working towards solving an answer.
It should be noted that the bar model is not a method of calculation, but in fact, it is used as a way to help children decide which Mathematical operation should be used.
Once a bar model has been developed, the children can start the calculation. This can be done using students' preferred written or mental calculation methods.
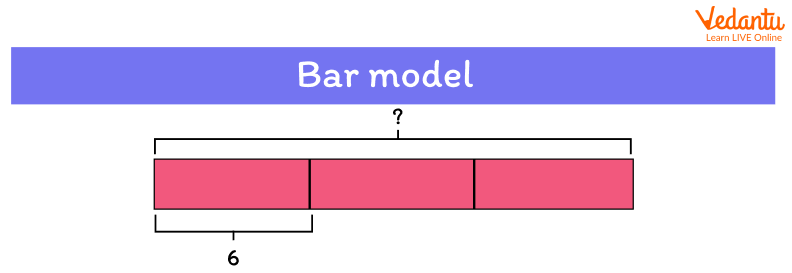
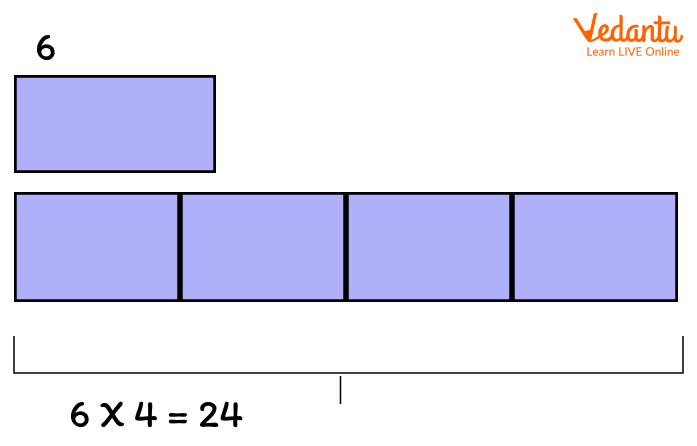
In the bar model given below, one bar or one rectangular box of the bar model represents the value of 6. Here, we have to find the 3 times the value of one bar.
Types of Bar Model
There are two types of bar models. They are:
Part-Whole Bar Model
Comparison Bar Model
Let us understand both the models briefly.
Part-Whole Model
The part-whole model, also known as the part-part whole model, is a pictorial representation of problems that help learners to observe the relationship between the numbers. A horizontal bar represents the whole amount. Below it, a similar bar is divided into pieces to represent the part of the whole.
Part whole model is further splitted into:
Discrete Part/Whole Model: In this model, each unit in the problem is represented by its own individual box, similar to using Numicon cubes. An example of discrete part/whole model is represented below:
Discrete Part/Whole Model Example:

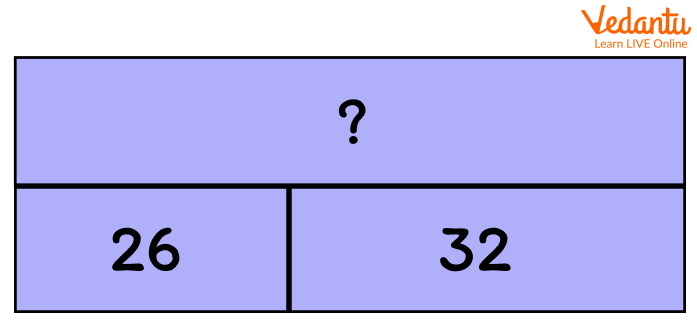
Continuous Part/ Whole Bar Model: In this model, units are grouped into one box for each amount in the problem. For example, in the problem, 26 + 32, 26 will have one longer bar, instead of having 26 small rectangles joined together.
Continuous Part/Whole Model Example
Part-Whole Model is ideal to solve:
Addition Problems
Subtraction Problems
Multiplication Problems
Division Problems
Fraction
Comparison Bar Model
Instead of having a bar which represents the whole problem, in a comparison model, two or more vertical bars are drawn to help children to compare two or more amounts. In this type of model, bars are often used to represent the whole amount.
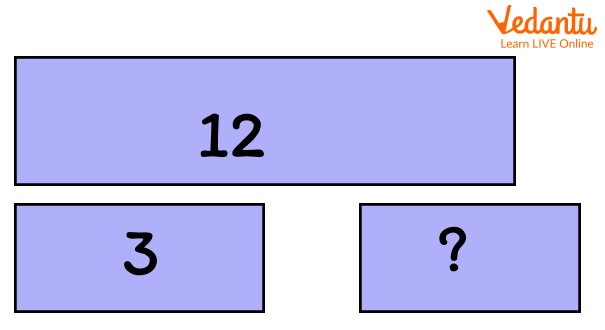
The comparison bar model is basically used to find the difference between two amounts, helping to strengthen the ideas of using subtraction to find the difference. Here is an example of a problem and comparison bar model representation.
Problem: Tina has 12 playing cards and Riya has 3. How many more cards does TIna have than the Riya?
Bar Models with Four Mathematical Operations
Here are bar models representing four Mathematical operations namely addition, subtraction, multiplication, and division.
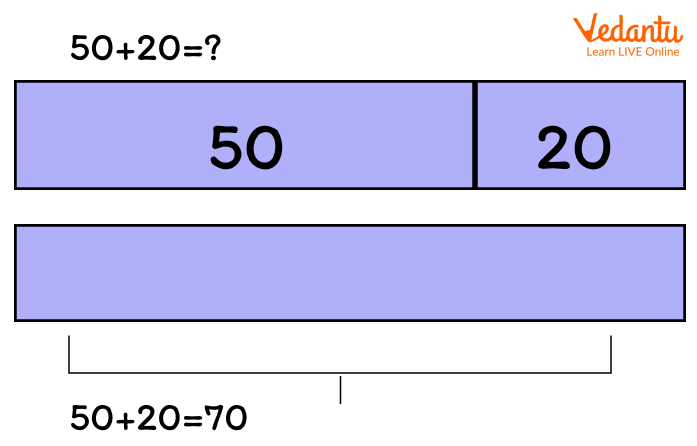
Bar Model Representing Addition
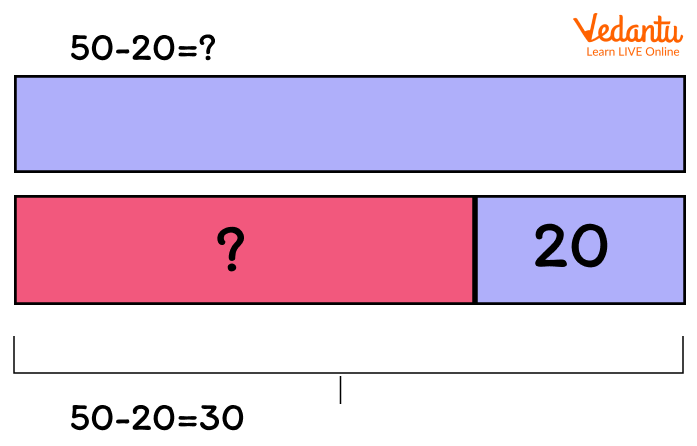
Bar Model Representing Subtraction
Bar Model Representing Multiplication
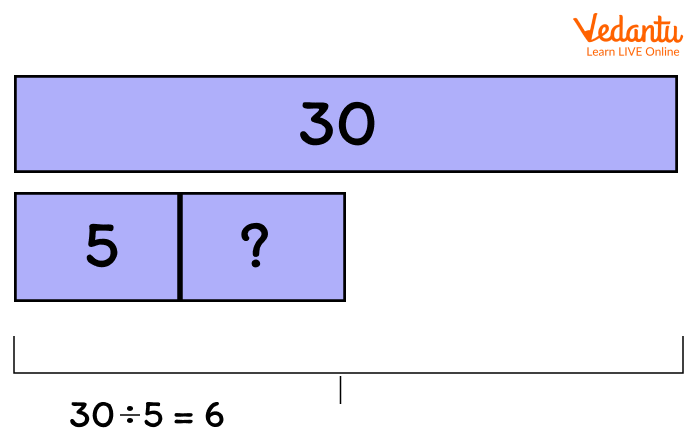
Bar Model Representing Division
Does the Bar Model Provide an Answer?
The bar model is a visual representation to help solve problems using different sized rectangles to represent the bar. The rectangles or bars in the bar model should be proportional so that the larger number is represented by the larger number.
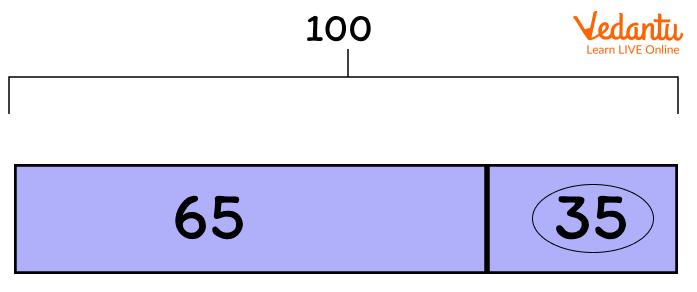
The bar model does not provide an answer but gives a clear understanding of what calculation is required to find an answer. For example, in the above problem, 35 is the answer as 65 and 100 are already given and we can solve this by taking 65 out of 100.
Conclusion
In short, the bar model is a pictorial representation of problems or concepts where bars or rectangular boxes are used to represent the known and unknown quantities. Bar models are used to solve numerical problems with four arithmetic operations namely addition, subtraction, multiplication, and division. In word problems, bar models help students to decide which Mathematical operation should be used to visualise problems.
FAQs on Bar Model in Maths for Visual Problem Solving
1. What is a bar model in maths?
A bar model is a visual method used to represent numbers and relationships using rectangular bars to solve word problems. It helps students see how quantities compare or combine.
- Each bar represents a number or part of a number.
- The length of the bar shows the size of the value.
- It is commonly used for addition, subtraction, multiplication, division, ratios, and fractions.
2. How do you use a bar model to solve a word problem?
To use a bar model, draw bars to represent the known and unknown quantities in the problem.
- Read the word problem carefully.
- Identify the known values and the unknown value.
- Draw bars to represent each quantity.
- Divide the bars into equal parts if needed.
- Use arithmetic operations to find the missing value.
3. Can you give an example of a bar model?
A simple bar model example is: Tom has 8 apples and buys 5 more, so the total is 13 apples.
- Draw one bar for 8 apples.
- Draw another bar for 5 apples next to it.
- Combine the bars to show 8 + 5.
- Calculate: 8 + 5 = 13.
4. How does a bar model help with addition and subtraction?
A bar model helps with addition and subtraction by visually showing how parts combine or how a total is split.
- For addition: Place bars side by side to find the total.
- For subtraction: Start with the total bar and remove the known part.
5. How do you use a bar model for multiplication?
A bar model for multiplication shows equal groups of the same size.
- Divide a bar into equal sections.
- Each section represents one group.
- Multiply the number of groups by the value in each group.
6. How do you use a bar model to solve division problems?
A bar model for division splits a total into equal parts to find the value of each part.
- Draw one bar representing the total.
- Divide it into equal sections.
- Calculate the value of each section.
7. How can a bar model be used for fractions?
A bar model for fractions represents the whole as one bar divided into equal parts.
- The full bar represents 1 whole.
- Divide it into equal sections based on the denominator.
- Shade parts based on the numerator.
8. What is the difference between a bar model and a number line?
The main difference is that a bar model shows part–whole relationships, while a number line shows numerical position and order.
- Bar model: Best for word problems and comparing quantities.
- Number line: Best for sequencing numbers and showing intervals.
9. Why is the bar model method important in primary maths?
The bar model method is important because it builds strong conceptual understanding before formal algebra.
- Helps students visualise mathematical relationships.
- Supports problem-solving skills.
- Prepares learners for algebraic equations.
10. Can bar models help with ratio problems?
Yes, a bar model is very effective for solving ratio problems by showing proportional parts clearly.
- Draw bars divided according to the ratio.
- Find the value of one part.
- Multiply to find each quantity.