


What is a Spreadsheet and How It Works with Formulas and Functions
A Spreadsheet is one of the most widely used software tools in computer science and business applications for organizing, calculating, and analyzing data. It allows users to store information in a tabular format using rows and columns, making data easy to manage and interpret. Spreadsheet programs like Microsoft Excel are commonly used in schools, offices, and industries for performing calculations, creating charts, maintaining records, and generating reports. Understanding spreadsheets is essential for students as it builds foundational skills in data handling, logical thinking, and digital productivity.
Definition and Meaning
Spreadsheet definition: In computer science, a spreadsheet is a software application that organizes data in a grid of rows and columns and performs calculations using formulas and functions.
- Cell: The intersection of a row and a column where data is entered.
- Row: A horizontal line of cells identified by numbers.
- Column: A vertical line of cells identified by letters.
- Worksheet: A single page within a spreadsheet file.
- Workbook: A file that contains one or more worksheets.
How It Works / Working Principle
The Spreadsheet working process is based on storing data in cells and performing calculations using formulas. Each cell can contain text, numbers, or formulas that automatically update when values change.
- Open the spreadsheet application such as Microsoft Excel.
- Enter data into cells using the keyboard.
- Use formulas like =A1+B1 to perform calculations.
- Apply formatting, charts, or functions to analyze data.
- Save the file as a workbook for future use.
When a value in a referenced cell changes, the spreadsheet automatically recalculates the result. This automatic recalculation is a key feature of spreadsheet software.
Types and Classification
There are different Spreadsheet types based on usage and platform:
- Desktop Spreadsheets: Installed on a computer. Example - Microsoft Excel, LibreOffice Calc.
- Web Based Spreadsheets: Run in a browser. Example - Google Sheets.
- Mobile Spreadsheets: Designed for smartphones and tablets.
Components and Structure
A spreadsheet consists of several important components:
- Title Bar: Displays the name of the workbook.
- Ribbon/Menu Bar: Contains tools and commands.
- Formula Bar: Shows the content or formula of the selected cell.
- Sheet Tabs: Switch between worksheets.
- Status Bar: Displays information about the current operation.
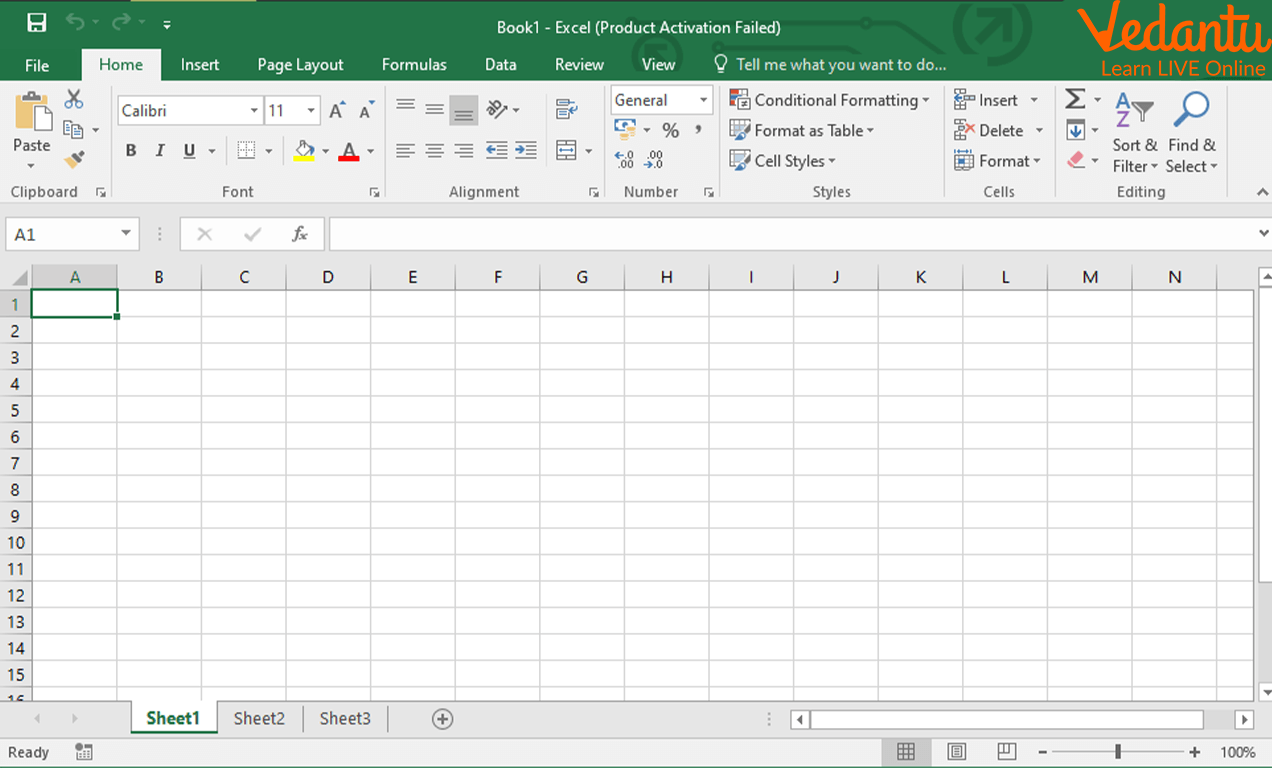
Example of a Spreadsheet in MS Excel:
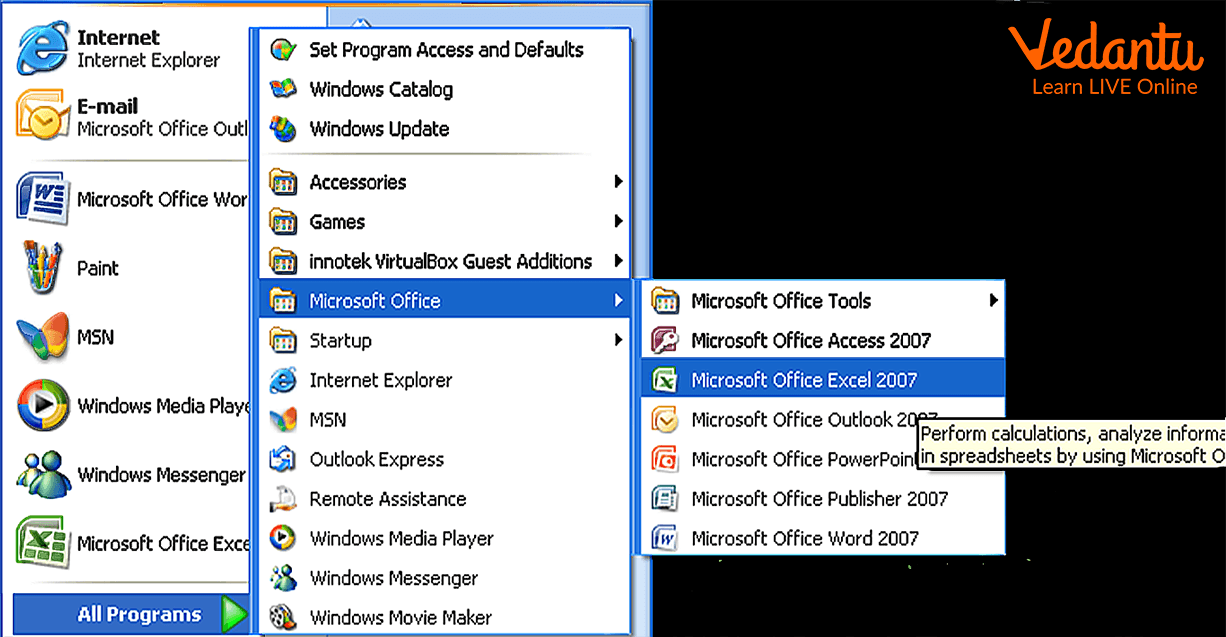
Steps to Open MS Excel:


Syntax and Example
Basic Formula Syntax
All formulas in a spreadsheet start with an equals sign (=).
=A1 + A2
=SUM(A1:A5)
=AVERAGE(B1:B10)
Example
If cell A1 contains 10 and A2 contains 20, entering =A1+A2 in A3 will display 30. The result updates automatically if the values change.
Features and Characteristics
- Automatic calculations using formulas and functions.
- Data organization in rows and columns.
- Chart and graph creation for data visualization.
- Sorting and filtering of data.
- Conditional formatting for highlighting important data.
Advantages
- Easy data management and organization.
- Quick and accurate calculations.
- Supports large amounts of data.
- Improves productivity and decision making.
Disadvantages / Limitations
- Prone to human errors in formulas.
- Not suitable for very complex database operations.
- Large files may slow down performance.
Applications and Use Cases
- Maintaining student marks and attendance records.
- Financial budgeting and accounting.
- Inventory management.
- Data analysis and reporting.
- Business forecasting and planning.
Quick Facts About Spreadsheet
| Category | Details |
|---|---|
| Type | Application Software |
| Popular Software | Microsoft Excel, Google Sheets |
| File Extension | .xlsx, .xls, .ods |
| Used For | Data calculation and analysis |
| Platform Support | Windows, macOS, Web, Mobile |
These facts highlight the importance of spreadsheets in computer science and daily computing tasks.
Key Terms / Glossary
| Term | Meaning |
|---|---|
| Formula | An equation used to perform calculations |
| Function | Predefined formula like SUM or AVERAGE |
| Cell Reference | Address of a cell such as A1 or B2 |
| Range | A group of selected cells |
Interesting Facts About Spreadsheet
- The first electronic spreadsheet was VisiCalc, released in 1979.
- Spreadsheets can handle millions of rows of data in modern versions.
- Formulas automatically update when referenced data changes.
- Spreadsheets support logical functions like IF for decision making.
- They are widely used in data science for preliminary data analysis.
- Macros can automate repetitive tasks in advanced spreadsheets.
Conclusion
A Spreadsheet in computer science is a powerful and essential tool for organizing, calculating, and analyzing data efficiently. With features like formulas, functions, charts, and automatic recalculation, spreadsheets simplify complex tasks in education, business, and research. Understanding spreadsheet concepts, components, and applications helps students develop strong data management skills and logical thinking. Mastery of spreadsheets contributes significantly to digital literacy and practical problem solving in today’s technology driven world.
FAQs on Spreadsheet Explained for Students and Programmers
1. What is a Spreadsheet in Computer Science?
A Spreadsheet is a software application used to store, organize, calculate, and analyze data in tabular form using rows and columns.
- Data is stored in cells identified by row and column labels (e.g., A1, B2).
- Common spreadsheet software includes Microsoft Excel, Google Sheets, and LibreOffice Calc.
- Widely used for data analysis, accounting, reporting, and exam-related practical tasks.
2. How does a Spreadsheet work?
A spreadsheet works by allowing users to enter data into cells and perform calculations using built-in formulas and functions.
- Each cell can contain text, numbers, or formulas.
- Formulas automatically recalculate when input data changes.
- Supports data processing, sorting, filtering, and visualization using charts.
3. What are the main components of a Spreadsheet?
The main components of a spreadsheet include structural and functional elements that help manage data efficiently.
- Workbook – A file containing one or more worksheets.
- Worksheet – A single sheet made of rows and columns.
- Cell – The intersection of a row and column.
- Formula Bar – Used to enter or edit data and formulas.
- Functions – Predefined formulas like SUM, AVERAGE, and IF.
4. What are formulas and functions in a Spreadsheet?
In a spreadsheet, a formula is an expression used to calculate values, while a function is a predefined built-in formula.
- Example of formula: =A1+B1
- Example of function: =SUM(A1:A5)
- Functions simplify complex calculations for data analysis and exam problems.
5. What are the common types of data used in a Spreadsheet?
Spreadsheets support different data types to perform accurate computation and data processing.
- Text (Labels) – Names or descriptions.
- Numbers (Values) – Used in calculations.
- Date and Time – For scheduling and records.
- Formulas – Expressions that compute results.
6. What are the key features of Spreadsheet software?
Spreadsheet software provides powerful features for data management, analysis, and visualization.
- Automatic calculations using formulas and functions.
- Sorting and filtering of data.
- Data visualization using charts and graphs.
- Support for macros and basic automation.
- Integration with databases and cloud computing platforms.
7. What are the advantages and disadvantages of using a Spreadsheet?
Spreadsheets are flexible and easy-to-use tools for data analysis but have certain limitations.
- Advantages: Easy calculations, data visualization, user-friendly interface, widely used in exams and offices.
- Disadvantages: Error-prone for large datasets, limited scalability compared to databases, weaker security controls.
8. How is a Spreadsheet different from a Database?
A spreadsheet is designed for simple data analysis and calculations, while a database is built for structured data storage and management at scale.
- Spreadsheets are ideal for small to medium datasets.
- Databases like MySQL and Oracle handle large, relational data.
- Databases use SQL queries, whereas spreadsheets use formulas and functions.
9. What are the real-world applications of Spreadsheets?
Spreadsheets are widely used in business, education, and data analysis tasks.
- Financial accounting and budgeting.
- Student result processing and exam data management.
- Business reporting and inventory tracking.
- Basic data analysis for machine learning preprocessing.
10. Why are Spreadsheets important for exams and interviews?
Spreadsheets are important for exams and interviews because they test practical knowledge of data handling and problem-solving skills.
- Common in school and college practical examinations.
- Frequently asked in job interviews for roles in IT, data analysis, and finance.
- Understanding formulas, functions, and data manipulation improves computational thinking.