


Which of the following graphs represents the correct Boyle’s law?
A.
B.
C.
D.
(i) A, B and C
(ii) A and D
(iii) B and C
(iv) A, B and D
Answer
572.4k+ views
Hint: Before moving to the graphs, we need to know about Boyle's law. It explains about the behavior of gases. It also explains the relationship between the volume of a gas and the pressure of a gas at constant temperature.
Complete step by step answer:
Let’s know about Boyle’s law in detail. We know that when a gas is applied with pressure, it takes up very less space. Thus we can say that when the pressure is high, the volume will be low. This is explained in Boyle’s law.
So we can say that pressure is inversely proportional to the volume of a gas.
It can expressed as:
\[{{P}}\alpha \dfrac{1}{{{V}}}\], where ${{P}}$ is the pressure of the gas and ${{V}}$ is the volume of a gas.
Also, ${{PV = k}}$, where ${{k}}$ is a constant.
Or ${{{P}}_1}{{{V}}_1}{{ = }}{{{P}}_2}{{{V}}_2}$, where ${{{P}}_1}$ is initial pressure, ${{{P}}_2}$ is the final pressure, ${{{V}}_1}$ is the initial volume and ${{{V}}_2}$ is the final volume.
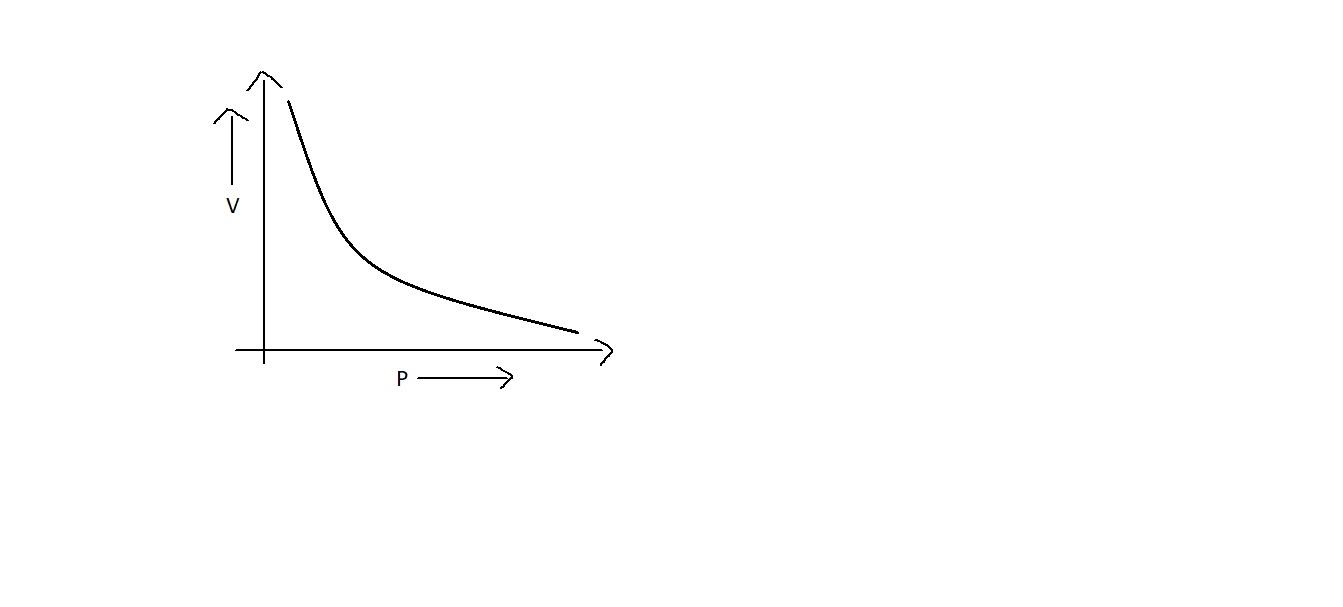
Now let’s focus on the graph of Boyle’s law. When we plot a graph between pressure and volume, we get a curve which is a downward one, as in option C. This shows that when pressure is increased, volume gets decreased.
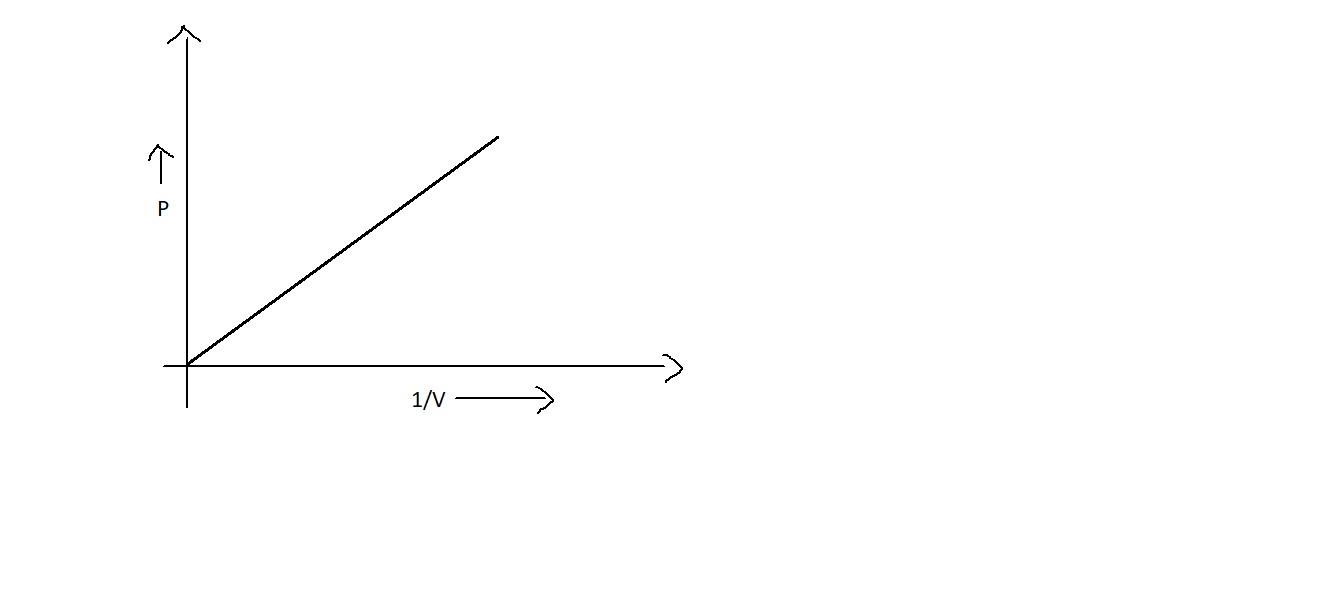
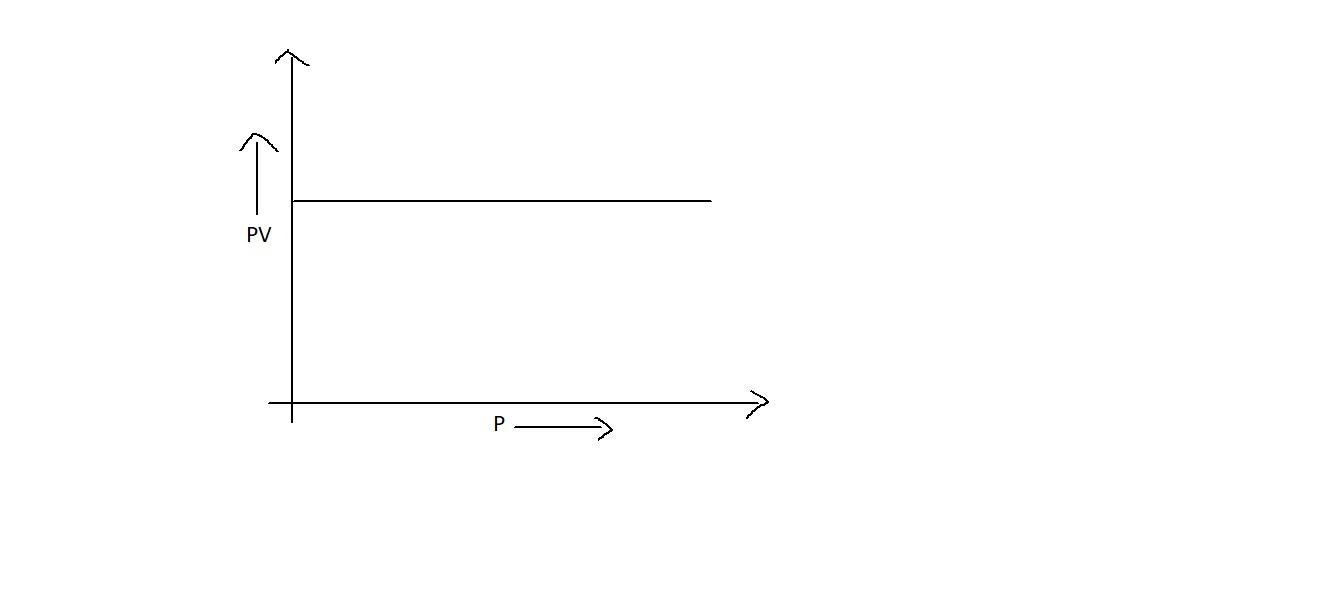
Since ${{PV = k}}$ is a constant, when we plot between ${{PV}}$ v/s ${{P}}$, even though the pressure is increased, it may not influence ${{PV}}$. Thus it will be a straight line which is parallel to the x axis as in option B. Also, it will be straight line when we plot a graph between ${{P}}$ and $\dfrac{1}{{{V}}}$ which will be starting from the origin as in option A. But option D is not correct.
Hence A, B and C are correct.
so the correct option for the question is option i.
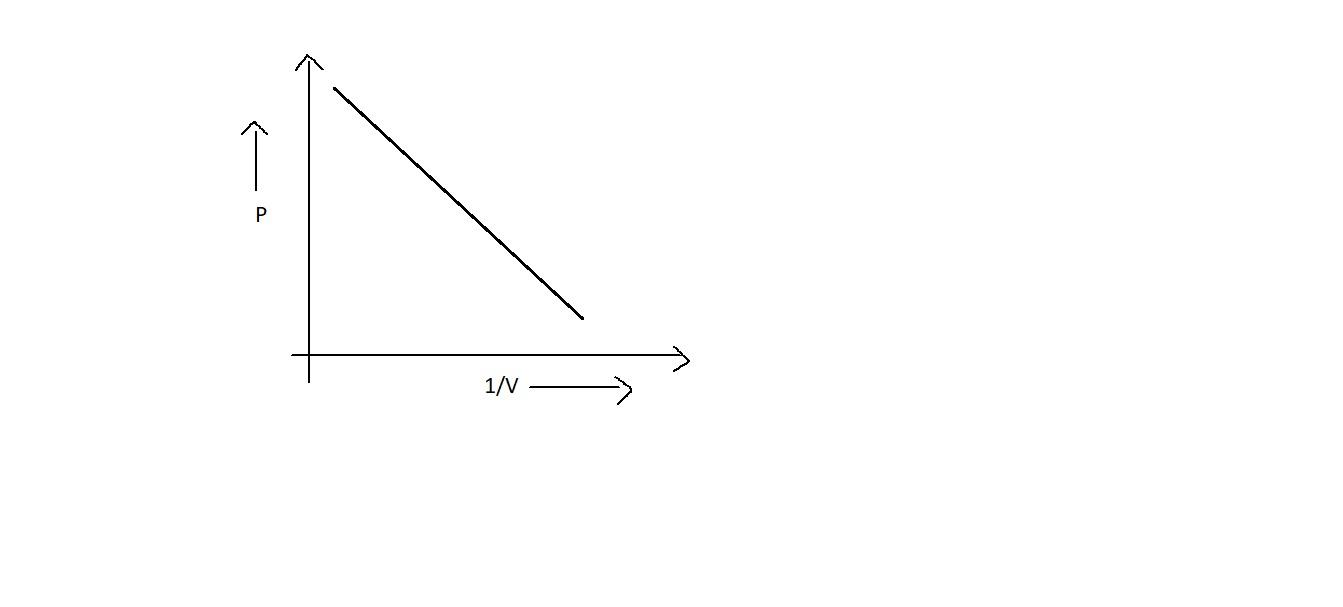
Note: In option D, the graph does not represent Boyle's law. When the inverse of volume is increased, i.e. the volume is decreased, the pressure is also decreased. Thus it states that pressure and volume are directly proportional. This is not correct.
Complete step by step answer:
Let’s know about Boyle’s law in detail. We know that when a gas is applied with pressure, it takes up very less space. Thus we can say that when the pressure is high, the volume will be low. This is explained in Boyle’s law.
So we can say that pressure is inversely proportional to the volume of a gas.
It can expressed as:
\[{{P}}\alpha \dfrac{1}{{{V}}}\], where ${{P}}$ is the pressure of the gas and ${{V}}$ is the volume of a gas.
Also, ${{PV = k}}$, where ${{k}}$ is a constant.
Or ${{{P}}_1}{{{V}}_1}{{ = }}{{{P}}_2}{{{V}}_2}$, where ${{{P}}_1}$ is initial pressure, ${{{P}}_2}$ is the final pressure, ${{{V}}_1}$ is the initial volume and ${{{V}}_2}$ is the final volume.
Now let’s focus on the graph of Boyle’s law. When we plot a graph between pressure and volume, we get a curve which is a downward one, as in option C. This shows that when pressure is increased, volume gets decreased.
Since ${{PV = k}}$ is a constant, when we plot between ${{PV}}$ v/s ${{P}}$, even though the pressure is increased, it may not influence ${{PV}}$. Thus it will be a straight line which is parallel to the x axis as in option B. Also, it will be straight line when we plot a graph between ${{P}}$ and $\dfrac{1}{{{V}}}$ which will be starting from the origin as in option A. But option D is not correct.
Hence A, B and C are correct.
so the correct option for the question is option i.
Note: In option D, the graph does not represent Boyle's law. When the inverse of volume is increased, i.e. the volume is decreased, the pressure is also decreased. Thus it states that pressure and volume are directly proportional. This is not correct.
Recently Updated Pages
Master Class 11 Business Studies: Engaging Questions & Answers for Success
Master Class 11 Computer Science: Engaging Questions & Answers for Success
Master Class 11 Economics: Engaging Questions & Answers for Success
Master Class 11 Social Science: Engaging Questions & Answers for Success
Master Class 11 English: Engaging Questions & Answers for Success
Master Class 11 Chemistry: Engaging Questions & Answers for Success
Trending doubts
Draw a diagram of nephron and explain its structur class 11 biology CBSE
Explain zero factorial class 11 maths CBSE
Chemical formula of Bleaching powder is A Ca2OCl2 B class 11 chemistry CBSE
Name the part of the brain responsible for the precision class 11 biology CBSE
The growth of tendril in pea plants is due to AEffect class 11 biology CBSE
One Metric ton is equal to kg A 10000 B 1000 C 100 class 11 physics CBSE