


Which of the following best describes the type of association shown in the scatterplot?

(A) linear, negative
(B) linear, positive
(C) exponential, positive
(D) exponential, negative
Answer
558.6k+ views
Hint: We are given a graph and we have to choose the most appropriate one from the given options about the type of association as depicted in the scatterplot. We see properties of a graph from left to right. And as we can see, as the value of ‘x’ increases there is no steady increase in the value of ‘y’, so it cannot be linear. Also, we can see that with the increase in the value of ‘x’ there is an increase in the value of ‘y’ in the positive ‘y’ direction. Hence, we will have the most appropriate option for the given scatterplot.
Complete step-by-step solution:
According to the given question, we are given a scatterplot and based on the scatterplot, we have to choose the most appropriate one from the given options. We are asked to tell which option best describes the type of association in the scatterplot.
When we study the properties of a graph we go from left to right.
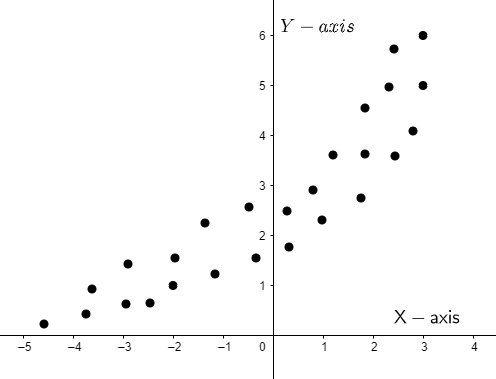
First of all, we can see that as the value of ‘x’ increases there is an increase in the value of ‘y’. But the point to be noted here is that there is no steady increase in the value of ‘y’ rather an abrupt increase, so we can say that the scatterplot does not depict a linear relationship between ‘x’ and ‘y’, it is rather an exponential increase.
Also, as there is an increase in the value of ‘y’ with an increase in the value of ‘x’, so the scatter plot depicts a positive increase.
Therefore, the correct answer is option (C) exponential, positive.
Note: The thing to keep in mind while studying a plot is that it should always be viewed from left to right and not the other way round. So also, if the value of ‘y’ should decrease with an increase in the value of ‘x’, then it is a negative relationship depicted in the plot.
Complete step-by-step solution:
According to the given question, we are given a scatterplot and based on the scatterplot, we have to choose the most appropriate one from the given options. We are asked to tell which option best describes the type of association in the scatterplot.
When we study the properties of a graph we go from left to right.
First of all, we can see that as the value of ‘x’ increases there is an increase in the value of ‘y’. But the point to be noted here is that there is no steady increase in the value of ‘y’ rather an abrupt increase, so we can say that the scatterplot does not depict a linear relationship between ‘x’ and ‘y’, it is rather an exponential increase.
Also, as there is an increase in the value of ‘y’ with an increase in the value of ‘x’, so the scatter plot depicts a positive increase.
Therefore, the correct answer is option (C) exponential, positive.
Note: The thing to keep in mind while studying a plot is that it should always be viewed from left to right and not the other way round. So also, if the value of ‘y’ should decrease with an increase in the value of ‘x’, then it is a negative relationship depicted in the plot.
Recently Updated Pages
Master Class 11 English: Engaging Questions & Answers for Success
Master Class 11 Social Science: Engaging Questions & Answers for Success
Master Class 11 Maths: Engaging Questions & Answers for Success
Master Class 11 Biology: Engaging Questions & Answers for Success
Master Class 11 Physics: Engaging Questions & Answers for Success
Master Class 11 Chemistry: Engaging Questions & Answers for Success
Trending doubts
One Metric ton is equal to kg A 10000 B 1000 C 100 class 11 physics CBSE
Difference Between Prokaryotic Cells and Eukaryotic Cells
Find the value of the expression given below sin 30circ class 11 maths CBSE
Two of the body parts which do not appear in MRI are class 11 biology CBSE
Draw a diagram of a plant cell and label at least eight class 11 biology CBSE
10 examples of friction in our daily life