


Use graph paper for this question. A survey regarding height (in cm) of 60 boys belonging to Class 10 of a school was conducted. The following data was recorded.
Height (in cm) 135-140 140-145 145-150 150-155 155-160 160-165 165-170 No. of boys 4 8 20 14 7 6 1
Taking 2cm = height of 10cm along one axis and 2cm = 10 boys along the other axis. Draw an ogive of the distribution. Use the graph to estimate the median.
| Height (in cm) | 135-140 | 140-145 | 145-150 | 150-155 | 155-160 | 160-165 | 165-170 |
| No. of boys | 4 | 8 | 20 | 14 | 7 | 6 | 1 |
Answer
552.9k+ views
Hint: To, draw an ogive of the given data set, we will have to find the cumulative frequency at each interval. After that, we can plot a graph of marks vs cumulative frequency. Here, as it is not mentioned whether to draw a “less than” ogive or a “more than” ogive, we can draw a simple “less than” ogive where the cumulative frequency increases with each class considered.
Then to find the median we will just take half of the total frequency and mark that point image in the graphs.
Complete Step by Step Solution:
As we will have to find out the cumulative frequency at each class and then plot a graph using the values of cumulative frequency and marks, it is best to draw a table with three columns as class interval, frequency, and cumulative frequency.
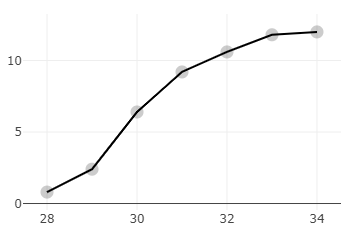
Now, as we have the values of cumulative frequency at each interval, we can plot a graph between the upper limit of each interval and the cumulative frequency at that class. Remember, the reason why we are plotting the graph with the upper limit of the interval is that we are drawing a “less than” type ogive where the cumulative frequency at an interval is less than the upper limit of that interval.
Now, for the median, we will have to find $\dfrac{N}{2}$, where N is the total frequency which is equal to 60 here.
Now, we will draw a straight line from 30, and wherever it will meet on the x-axis, that will be our median.
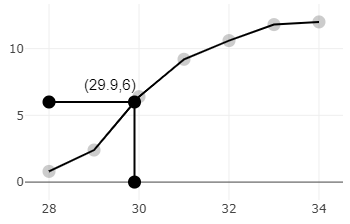
Hence, the median is 29.9.
Note: We should plot the upper-class limits, not the lower-class limits. If we plot lower class limits it would give the wrong ogive of the distribution. We should plot cumulative frequency not frequency. Do not plot cumulative frequency on X-axis and the upper limit on Y-axis.
Then to find the median we will just take half of the total frequency and mark that point image in the graphs.
Complete Step by Step Solution:
As we will have to find out the cumulative frequency at each class and then plot a graph using the values of cumulative frequency and marks, it is best to draw a table with three columns as class interval, frequency, and cumulative frequency.
| Height (in cm) | Frequency | Cumulative Frequency |
| 135 – 140 | 4 | 4 |
| 140 – 145 | 8 | 12 |
| 145 – 150 | 20 | 32 |
| 150 – 155 | 14 | 46 |
| 155 – 160 | 7 | 53 |
| 160 – 165 | 6 | 59 |
| 165 – 170 | 1 | 60 |
Now, as we have the values of cumulative frequency at each interval, we can plot a graph between the upper limit of each interval and the cumulative frequency at that class. Remember, the reason why we are plotting the graph with the upper limit of the interval is that we are drawing a “less than” type ogive where the cumulative frequency at an interval is less than the upper limit of that interval.
Now, for the median, we will have to find $\dfrac{N}{2}$, where N is the total frequency which is equal to 60 here.
Now, we will draw a straight line from 30, and wherever it will meet on the x-axis, that will be our median.
Hence, the median is 29.9.
Note: We should plot the upper-class limits, not the lower-class limits. If we plot lower class limits it would give the wrong ogive of the distribution. We should plot cumulative frequency not frequency. Do not plot cumulative frequency on X-axis and the upper limit on Y-axis.
Recently Updated Pages
Master Class 11 Computer Science: Engaging Questions & Answers for Success
Master Class 11 Business Studies: Engaging Questions & Answers for Success
Master Class 11 Economics: Engaging Questions & Answers for Success
Master Class 11 English: Engaging Questions & Answers for Success
Master Class 11 Maths: Engaging Questions & Answers for Success
Master Class 11 Biology: Engaging Questions & Answers for Success
Trending doubts
One Metric ton is equal to kg A 10000 B 1000 C 100 class 11 physics CBSE
There are 720 permutations of the digits 1 2 3 4 5 class 11 maths CBSE
Discuss the various forms of bacteria class 11 biology CBSE
Draw a diagram of a plant cell and label at least eight class 11 biology CBSE
State the laws of reflection of light
Explain zero factorial class 11 maths CBSE