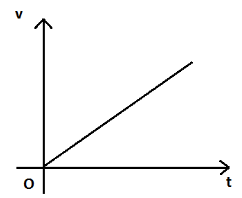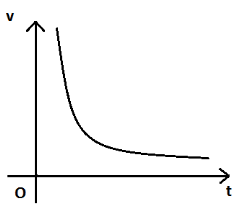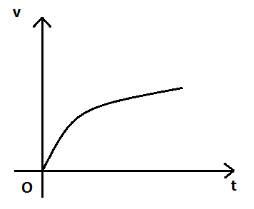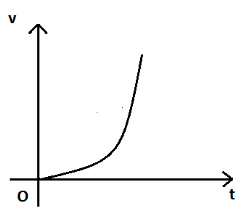
The speed v varies with time as \[\sqrt v = t\], the correct graph between $v$ and $t$ will be
A.

B.

C.

D.


Answer
553.2k+ views
Hint: In this question, the equation provided here, between the velocity of the body and the time interval, we will try to convert it in a way where the power of the velocity which is in the Y-axis equal to one. By doing this, we will then analyze the equation and find out which type of curve represents the equation.
Complete answer:
Here, the graphs are shown for the velocity on the Y-axis and the time for the X-axis for the graph. Velocity is a vector quantity. It is defined as the displacement of the particle when it travels per unit second of a time. The unit of velocity is \[m/s\]. In terms of formula, velocity is given as \[v = \dfrac{d}{t}\]. Here, v is the velocity, d is the displacement and t is the time taken by the body to travel a displacement d.
Here, in our case, the relationship between velocity and time is provided as \[\sqrt v = t\].Thus, to obtain a velocity time graph, we will have to make velocity, the subject of the formula. Hence, squaring both the sides of the above equation, we will obtain time in terms of velocity as shown below.
\[v = {t^2}\]
Above is an equation for a parabola curving towards the Y-axis.
Hence, option D is the correct answer.
Note: Here, for an equation of parabola, the parabola is always in two quadrants, for example, for the equation\[v = {t^2}\] the parabola for the equation lays in the first quadrant as well as the second quadrant. But the reason that the answer only lies in the first quadrant is because the negative value of the Y-axis is not allowed as there are no negative values in a square root.
Recently Updated Pages
Master Class 11 Computer Science: Engaging Questions & Answers for Success

Master Class 11 Business Studies: Engaging Questions & Answers for Success

Master Class 11 Economics: Engaging Questions & Answers for Success

Master Class 11 English: Engaging Questions & Answers for Success

Master Class 11 Maths: Engaging Questions & Answers for Success

Master Class 11 Biology: Engaging Questions & Answers for Success

Trending doubts
One Metric ton is equal to kg A 10000 B 1000 C 100 class 11 physics CBSE

There are 720 permutations of the digits 1 2 3 4 5 class 11 maths CBSE

Discuss the various forms of bacteria class 11 biology CBSE

Draw a diagram of a plant cell and label at least eight class 11 biology CBSE

State the laws of reflection of light

Explain zero factorial class 11 maths CBSE


