


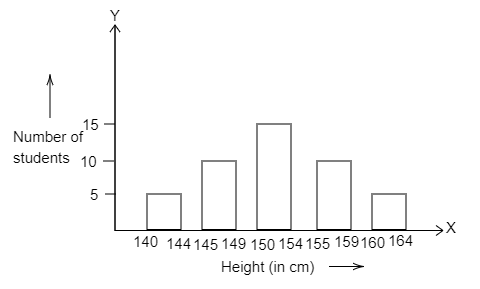
The bar graph represents the heights (in cm) of $50$ students of class XI of a particular school. Study the graph and answer the following question:
State whether true or false:
Maximum height (in cm) of a student in the class is 17.
Answer
552.9k+ views
Hint: Observe that the given bar graph is drawn as number students against the heights of the students measured in cm. Go through the measures for each data carefully. Interpret the data correctly. First see what each bar is describing mathematically and then based on that answer the question using the information gathered.
Complete step by step solution:
On the $y$-axis we have a number of students. We observe that it ranges from $0$ to $20$. Therefore for a particular height there are maximum $20$ students whose height lies in that range.
On the $x$ -axis we have the height of the students measured in centimetre. The minimum height is $140$ cm and maximum are $165$. Therefore, all the height value lies in this interval.
Now let us see what each bar in the bar graph represents.
The first bar starts at the $x$ value between $140 - 144$ and it corresponds to the $y$ value of $5$. This means that there are a total $5$ students with height in the range of $140 - 144$ cm.
The second bar starts at the $x$ value between $145 - 149$ and it corresponds to the $y$ value of $10$. This means that there are total $10$ students with height in the range of $145 - 149$ cm.
The third bar starts at the $x$ value between $150 - 154$ and it corresponds to the $y$ value of $17$. This means that there are total $17$ students with height in the range of $150 - 154$ cm.
The fourth bar starts at the $x$ value between $155 - 159$ and it corresponds to the $y$ value of $7$. This means that there are a total $7$ students with height in the range of $155 - 159$ cm.
The fifth bar starts at the $x$ value between $160 - 164$ and it corresponds to the $y$ value of $5$. This means that there are a total $5$ students with height in the range of $140 - 144$ cm.
Therefore, we can say that the maximum number of students with height in the range of $150 - 154$ and the number is $17$ but it doesn’t mean that the maximum height (in cm) of a student in the class is $17$ .
Thus, the correct answer is false.
Note: Here the important thing to note is that the graph cannot say anything about the height of an individual student so we cannot really determine the height of the particular student. Thus, it was clear that the given statement is false when it talks about the height of the individual student. But to be sure we need to study in detail.
Recently Updated Pages
Master Class 11 Computer Science: Engaging Questions & Answers for Success
Master Class 11 Business Studies: Engaging Questions & Answers for Success
Master Class 11 Economics: Engaging Questions & Answers for Success
Master Class 11 English: Engaging Questions & Answers for Success
Master Class 11 Maths: Engaging Questions & Answers for Success
Master Class 11 Biology: Engaging Questions & Answers for Success
Trending doubts
One Metric ton is equal to kg A 10000 B 1000 C 100 class 11 physics CBSE
There are 720 permutations of the digits 1 2 3 4 5 class 11 maths CBSE
Discuss the various forms of bacteria class 11 biology CBSE
Draw a diagram of a plant cell and label at least eight class 11 biology CBSE
State the laws of reflection of light
Explain zero factorial class 11 maths CBSE