


How do you solve and graph the inequality $6x + 5 \geqslant 7x$ ?
Answer
530.7k+ views
Hint: In the given question, we have to solve and plot the graph of the inequality given to us in the problem. We can solve the inequality using the simple algebraic rules of simplification and transposition rule. Then, we can plot the simplified form of the inequality obtained.
Complete step by step solution:
Here in this question, the inequality provided to us is $6x + 5 \geqslant 7x$ .
Now, we shift all the terms consisting of x to the right side of the question. So, we get,
$ \Rightarrow 5 \geqslant 7x - 6x$
Simplifying the inequality further, we get,
$ \Rightarrow x \leqslant 5$
Hence, the solution of the inequality $6x + 5 \geqslant 7x$ are all the real values of $x$ less than or equal to $5$.
So, the simplified form of the inequality $6x + 5 \geqslant 7x$ is $x \leqslant 5$ obtained by using the transposition and algebraic simplification rules.
Now, we have to graph the inequality $6x + 5 \geqslant 7x$. To graph the original inequality $6x + 5 \geqslant 7x$, we can graph the inequality obtained after simplifying the inequality using the transposition rule $x \leqslant 5$.
So, to plot the graph of an inequality, we have to first sketch the graph of the line obtained by replacing the inequality sign by “equals to sign.” Then, the line divides the Cartesian plane into two halves. We put coordinates of the points from both the regions and points from whichever region satisfies the inequality, that region represents the graph of the inequality.
So, we replace the inequality sign in inequality $x \leqslant 5$ with an “equals to” sign so as to get the equation of a line.
So, we get the equation of the line as $x = 5$.
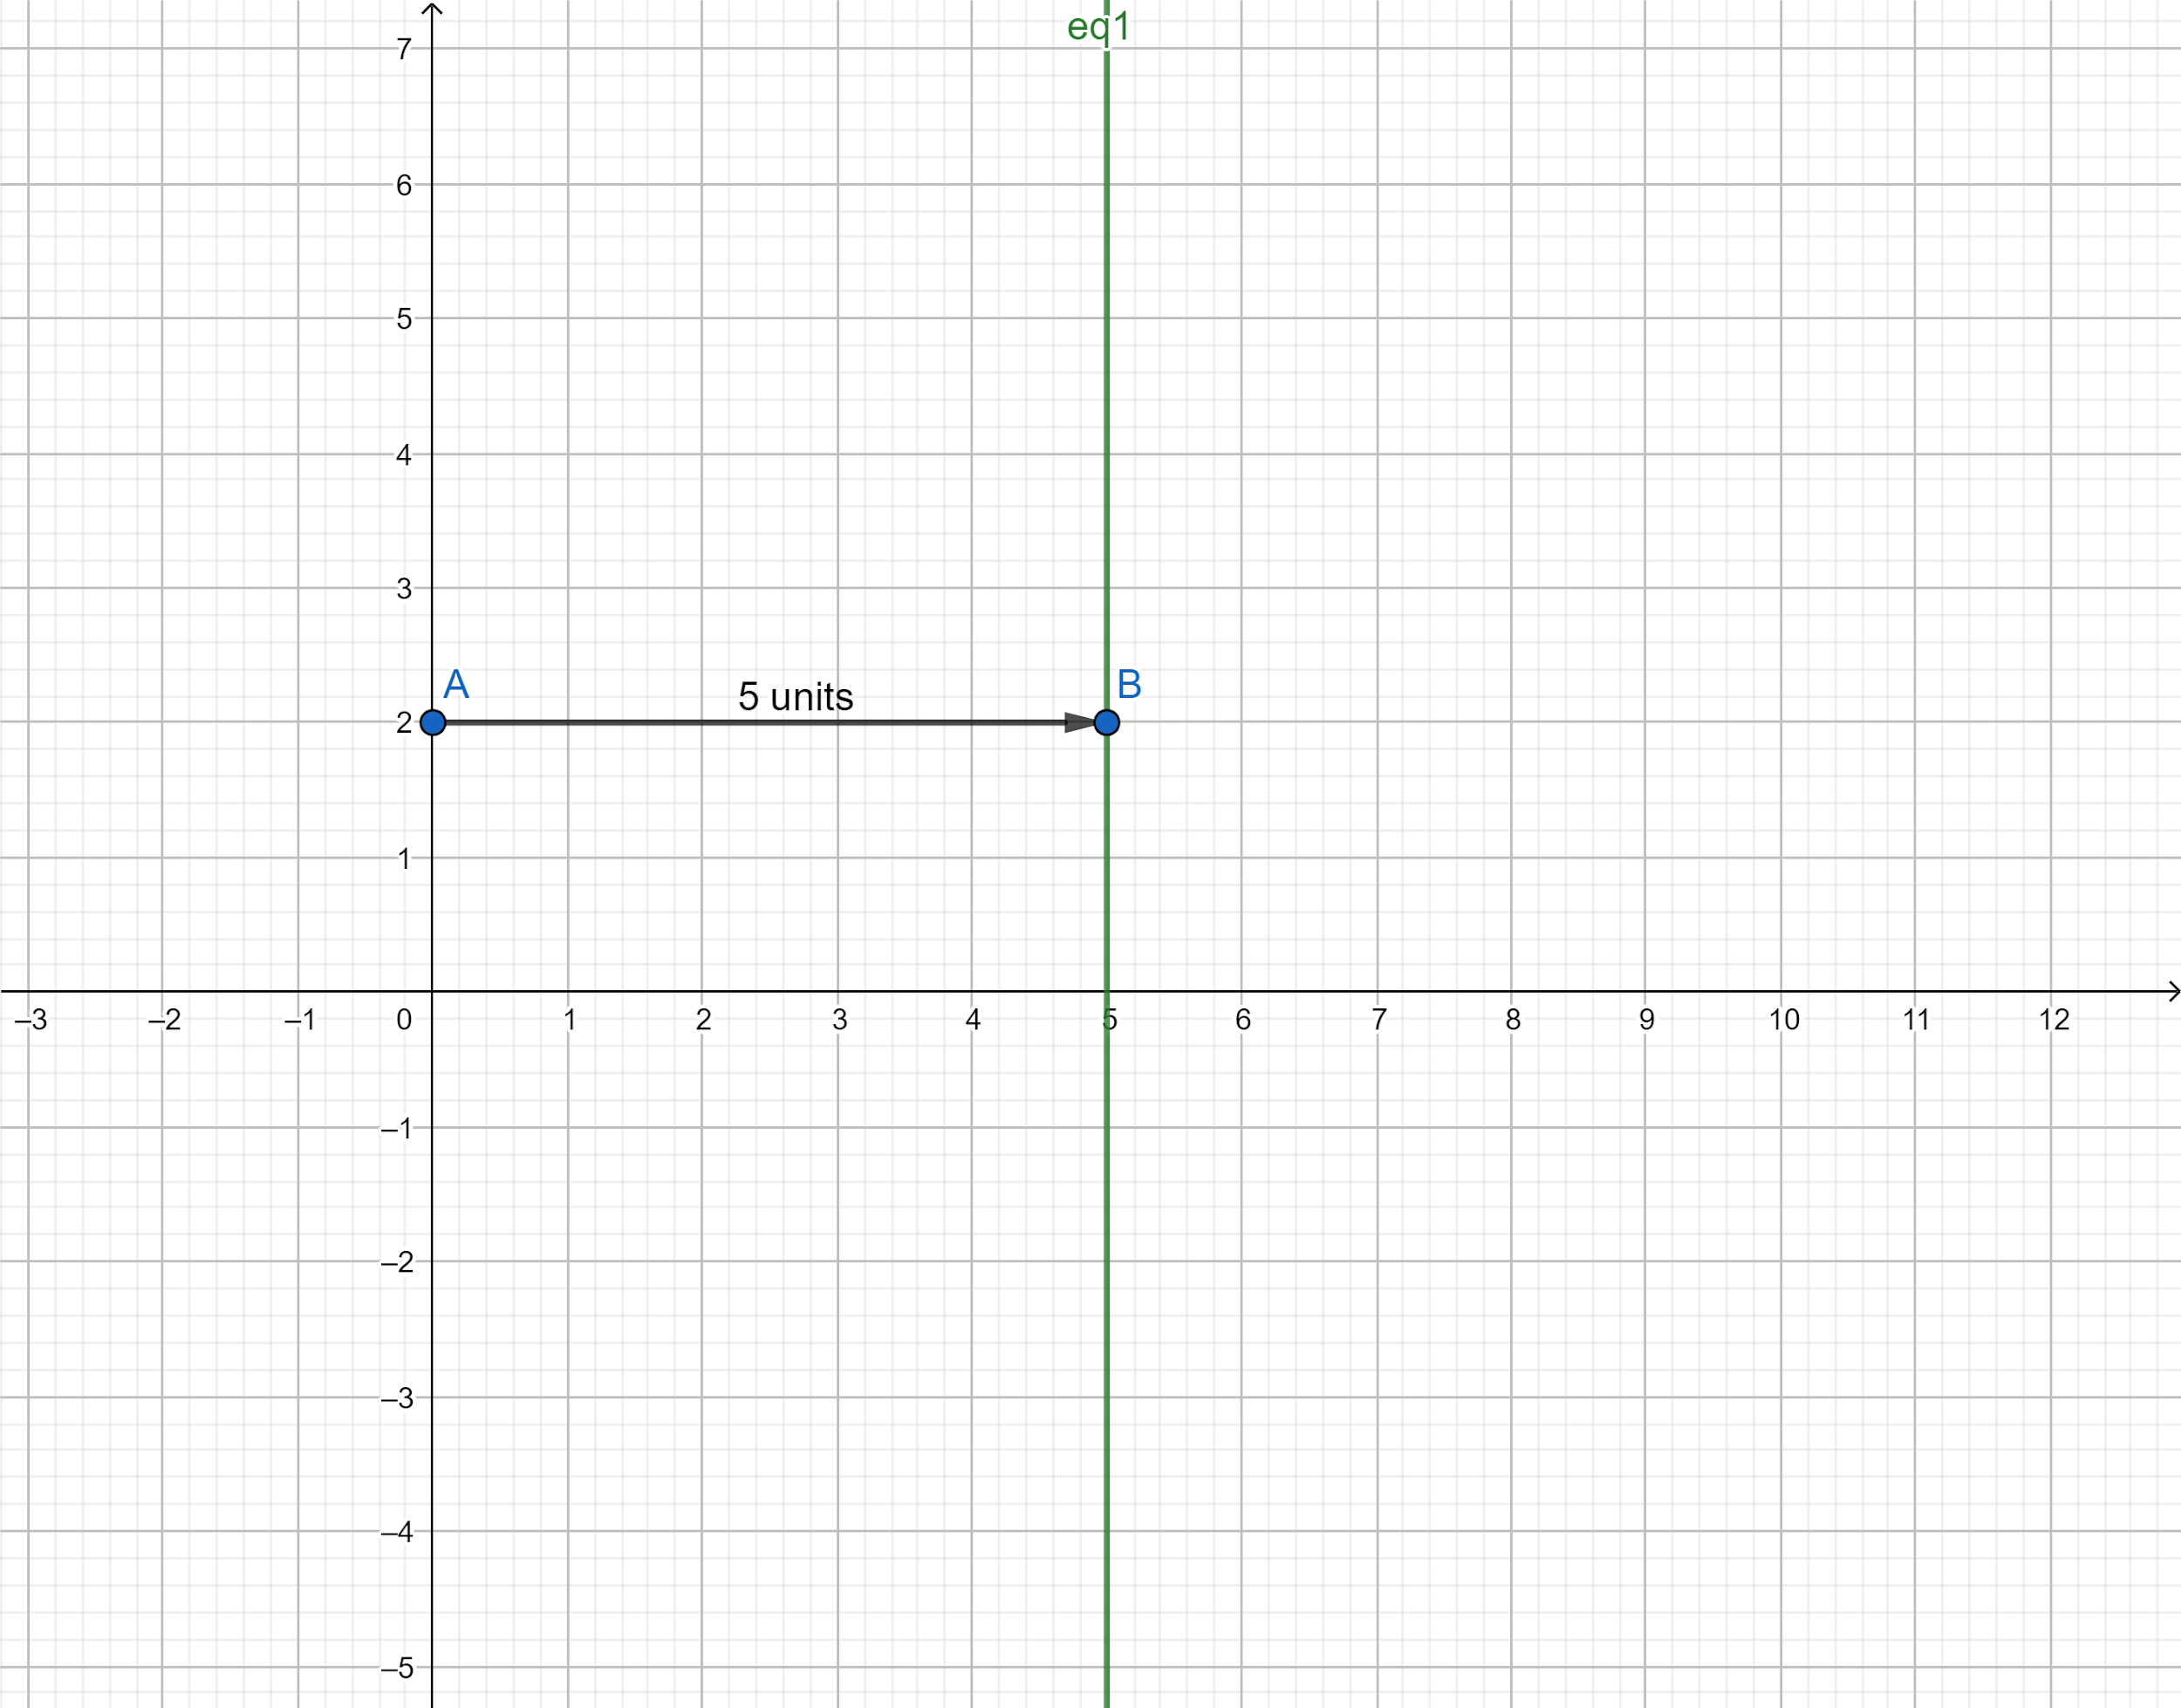
Hence, now we draw the graph of the line $x = 5$. The line represented by the equation $x = 5$ is parallel to the y-axis and is at a distance of $5$ units from the y-axis.
Hence, the graph plotted for the obtained line is represented below:
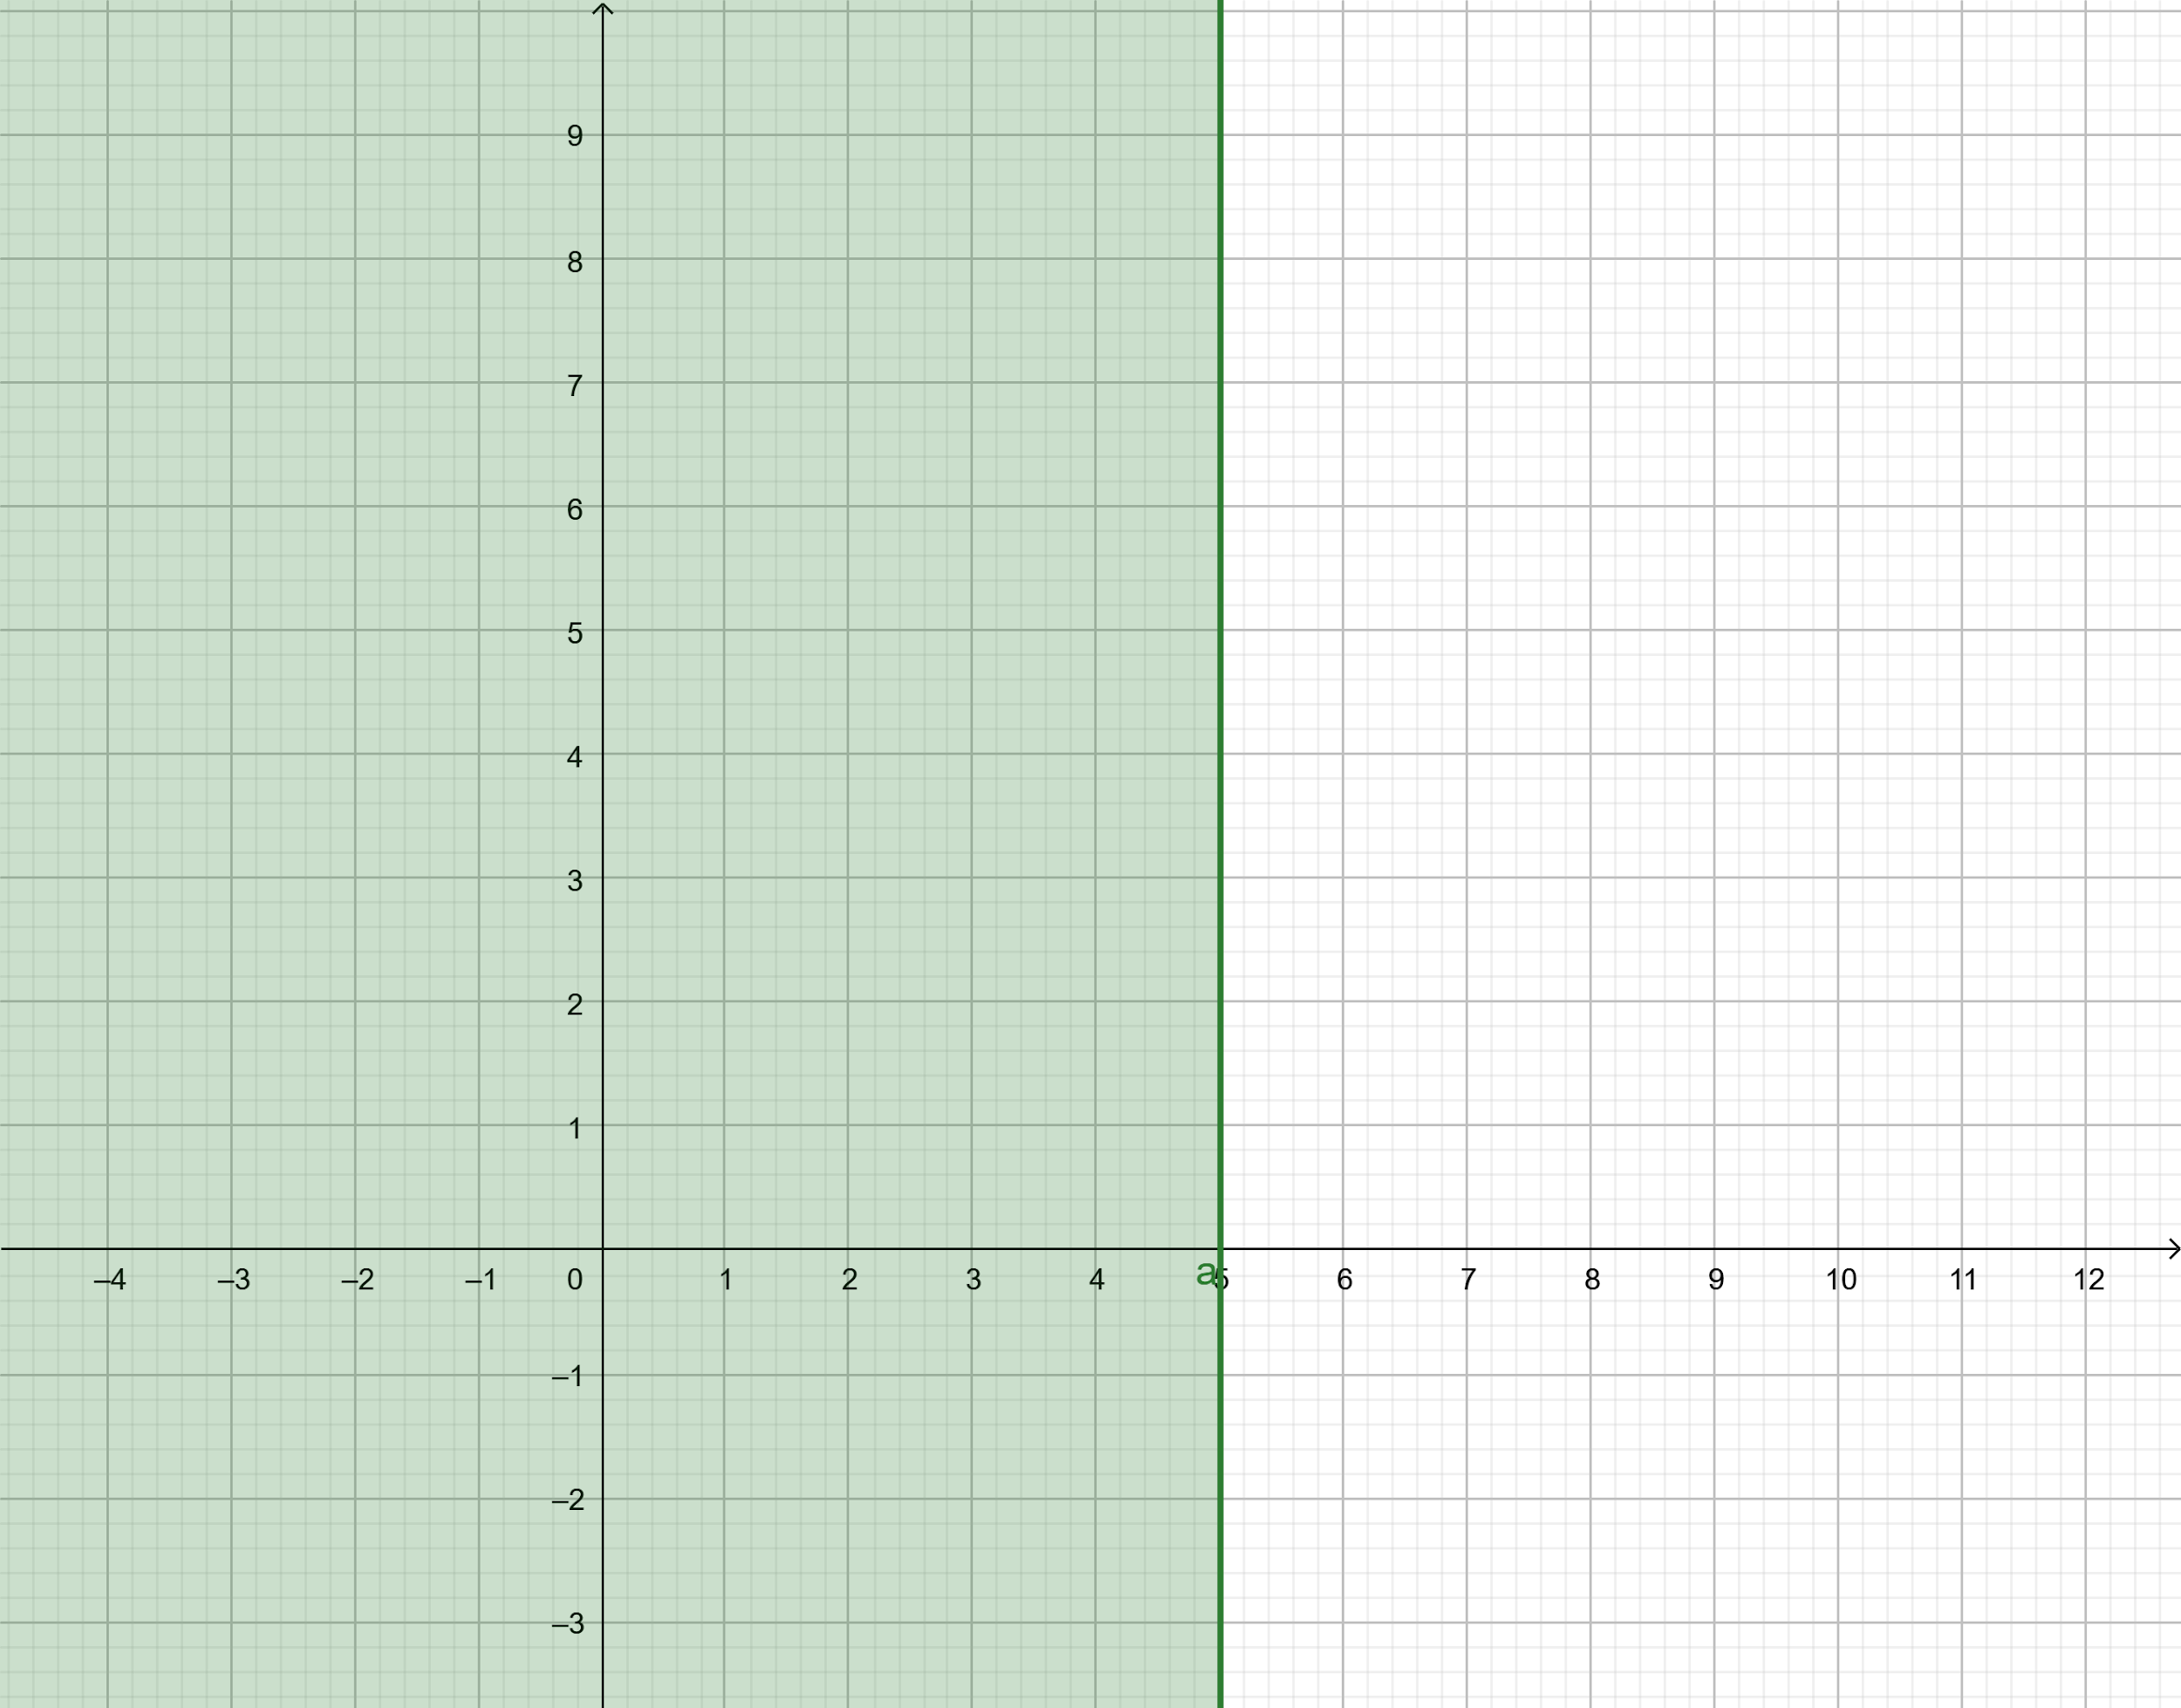
We know that a line divides the Cartesian plane into two halves. After drawing the graph of the line, we choose which half represents the inequality given to us in the problem. We substitute the coordinates of one point lying in both the regions and the region consisting of the point that satisfies the inequality is the graph of that inequality.
So, we substitute the coordinates of the origin in the inequality $6x + 5 \geqslant 7x$.
So, we get,
$ \Rightarrow 6\left( 0 \right) + 5 \geqslant 7\left( 0 \right)$
$ \Rightarrow 5 \geqslant 0$
We know that the above expression is true. Hence, the coordinates of origin satisfy the given inequality.
Hence, the graph of the inequality consists of the region consisting of the origin. So, we get the graph of the inequality as:
Note:
The graph plotted is a two dimensional graph in x-axis versus y-axis. This is the easiest way of solving such a question and the solution can be referred whenever one needs to do any other question of the same type.
Complete step by step solution:
Here in this question, the inequality provided to us is $6x + 5 \geqslant 7x$ .
Now, we shift all the terms consisting of x to the right side of the question. So, we get,
$ \Rightarrow 5 \geqslant 7x - 6x$
Simplifying the inequality further, we get,
$ \Rightarrow x \leqslant 5$
Hence, the solution of the inequality $6x + 5 \geqslant 7x$ are all the real values of $x$ less than or equal to $5$.
So, the simplified form of the inequality $6x + 5 \geqslant 7x$ is $x \leqslant 5$ obtained by using the transposition and algebraic simplification rules.
Now, we have to graph the inequality $6x + 5 \geqslant 7x$. To graph the original inequality $6x + 5 \geqslant 7x$, we can graph the inequality obtained after simplifying the inequality using the transposition rule $x \leqslant 5$.
So, to plot the graph of an inequality, we have to first sketch the graph of the line obtained by replacing the inequality sign by “equals to sign.” Then, the line divides the Cartesian plane into two halves. We put coordinates of the points from both the regions and points from whichever region satisfies the inequality, that region represents the graph of the inequality.
So, we replace the inequality sign in inequality $x \leqslant 5$ with an “equals to” sign so as to get the equation of a line.
So, we get the equation of the line as $x = 5$.
Hence, now we draw the graph of the line $x = 5$. The line represented by the equation $x = 5$ is parallel to the y-axis and is at a distance of $5$ units from the y-axis.
Hence, the graph plotted for the obtained line is represented below:
We know that a line divides the Cartesian plane into two halves. After drawing the graph of the line, we choose which half represents the inequality given to us in the problem. We substitute the coordinates of one point lying in both the regions and the region consisting of the point that satisfies the inequality is the graph of that inequality.
So, we substitute the coordinates of the origin in the inequality $6x + 5 \geqslant 7x$.
So, we get,
$ \Rightarrow 6\left( 0 \right) + 5 \geqslant 7\left( 0 \right)$
$ \Rightarrow 5 \geqslant 0$
We know that the above expression is true. Hence, the coordinates of origin satisfy the given inequality.
Hence, the graph of the inequality consists of the region consisting of the origin. So, we get the graph of the inequality as:
Note:
The graph plotted is a two dimensional graph in x-axis versus y-axis. This is the easiest way of solving such a question and the solution can be referred whenever one needs to do any other question of the same type.
Recently Updated Pages
Basicity of sulphurous acid and sulphuric acid are
Master Class 11 Business Studies: Engaging Questions & Answers for Success
Master Class 11 Computer Science: Engaging Questions & Answers for Success
Master Class 11 Economics: Engaging Questions & Answers for Success
Master Class 11 Social Science: Engaging Questions & Answers for Success
Master Class 11 English: Engaging Questions & Answers for Success
Trending doubts
One Metric ton is equal to kg A 10000 B 1000 C 100 class 11 physics CBSE
The largest wind power cluster is located in the state class 11 social science CBSE
Explain zero factorial class 11 maths CBSE
State and prove Bernoullis theorem class 11 physics CBSE
What steps did the French revolutionaries take to create class 11 social science CBSE
Which among the following are examples of coming together class 11 social science CBSE