


Sketch the graph \[y=|x-1|\]. Evaluate \[\int\limits_{-2}^{4}{|x-1|dx}\]. What does this value of the integral represent on the graph?
Answer
552.3k+ views
Hint: We are given a question to sketch the graph of a given function. We will first remove the modulus function by equating it to zero, we will then have the value of x for which the function gives 0 and then we will split the interval based on the increasing and decreasing of the given function. Then we also have to integrate the function and write the integral value of the given function. The integral value of the given integral tells us about the area of the region covered by the function between the given interval.
Complete step by step solution:
According to the given question, we are given a function whose graph we have to sketch.
The given function we have is,
\[y=|x-1|\]
As we can see that the given function has a modulus function so in order to chart out the graph of this function, we will have to remove the modulus function. We will first equate the given function to 0, we get,
\[y=x-1=0\]
So, we get the value of ‘x’ as,
\[\Rightarrow x=1\]
That is,
\[|x-1|\] for \[x>1\], we have \[x-1\]
\[|x-1|\] for \[x<1\], we have \[1-x\]
We have,
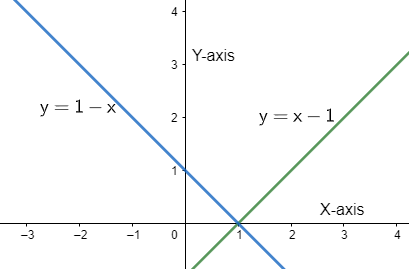
The first equation as, \[y=x-1\]
And the second equation as, \[y=1-x\]
We will take the points where ‘x’ is taken as 0 once and ‘y’ is taken as 0. We will join the points. Doing the same for both the equations.
So, we have the graph of the equations as,
Next, we will integrate the given function over the interval -2 to 4, that is, the expression we have is,
\[\int\limits_{-2}^{4}{|x-1|dx}\]
As per the above calculations, we will now split up the intervals and we will get,
\[\int\limits_{-2}^{4}{|x-1|dx}=\int\limits_{-2}^{1}{|x-1|dx}+\int\limits_{1}^{4}{|x-1|dx}\]
We now get the integrals as,
\[\Rightarrow \int\limits_{-2}^{1}{\left( 1-x \right)dx}+\int\limits_{1}^{4}{\left( x-1 \right)dx}\]
Integrating the terms within the brackets, we get the expression as,
\[\Rightarrow \left[ x-\dfrac{{{x}^{2}}}{2} \right]_{-2}^{1}+\left[ \dfrac{{{x}^{2}}}{2}-x \right]_{1}^{4}\]
Putting the intervals as the value of ‘x’, we get,
\[\Rightarrow \left[ \left( 1-\dfrac{1}{2} \right)-\left( \left( -2 \right)-\dfrac{4}{2} \right) \right]+\left[ \left( \dfrac{16}{2}-4 \right)-\left( \dfrac{1}{2}-1 \right) \right]\]
We will now solve the given expression and we get the value of the expression as,
\[\Rightarrow \left[ \left( \dfrac{1}{2} \right)-\left( \dfrac{-4-4}{2} \right) \right]+\left[ \left( 8-4 \right)-\left( -\dfrac{1}{2} \right) \right]\]
Solving further, we have the expression as,
\[\Rightarrow \left[ \left( \dfrac{1}{2} \right)-\left( \dfrac{-8}{2} \right) \right]+\left[ \left( 4 \right)+\left( \dfrac{1}{2} \right) \right]\]
Adding up the terms by taking the LCM, we get,
\[\Rightarrow \left[ \left( \dfrac{1+8}{2} \right) \right]+\left[ \left( \dfrac{8+1}{2} \right) \right]\]
\[\Rightarrow \left[ \left( \dfrac{9}{2} \right) \right]+\left[ \left( \dfrac{9}{2} \right) \right]\]
We get the value of the integral as,
\[\Rightarrow \dfrac{9}{2}+\dfrac{9}{2}=9sq.units\]
This integral value that we have obtained is the area of the region bounded by the lines within the interval -2 to 4, that is,
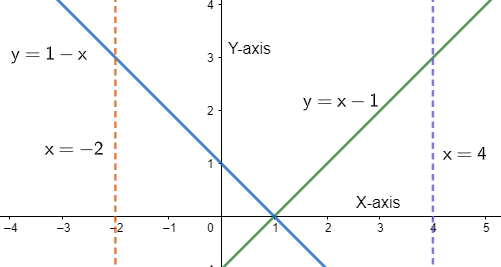
Note: The modulus function consists of both positive and negative values. So, before plotting a modulus function on a graph it is necessary to consider all the possible equations that the function can have without the modulus. Also, the plotting of the graph can be done without taking all the points and taking the intercept point of x and y axis’.
Complete step by step solution:
According to the given question, we are given a function whose graph we have to sketch.
The given function we have is,
\[y=|x-1|\]
As we can see that the given function has a modulus function so in order to chart out the graph of this function, we will have to remove the modulus function. We will first equate the given function to 0, we get,
\[y=x-1=0\]
So, we get the value of ‘x’ as,
\[\Rightarrow x=1\]
That is,
\[|x-1|\] for \[x>1\], we have \[x-1\]
\[|x-1|\] for \[x<1\], we have \[1-x\]
We have,
The first equation as, \[y=x-1\]
And the second equation as, \[y=1-x\]
We will take the points where ‘x’ is taken as 0 once and ‘y’ is taken as 0. We will join the points. Doing the same for both the equations.
So, we have the graph of the equations as,
Next, we will integrate the given function over the interval -2 to 4, that is, the expression we have is,
\[\int\limits_{-2}^{4}{|x-1|dx}\]
As per the above calculations, we will now split up the intervals and we will get,
\[\int\limits_{-2}^{4}{|x-1|dx}=\int\limits_{-2}^{1}{|x-1|dx}+\int\limits_{1}^{4}{|x-1|dx}\]
We now get the integrals as,
\[\Rightarrow \int\limits_{-2}^{1}{\left( 1-x \right)dx}+\int\limits_{1}^{4}{\left( x-1 \right)dx}\]
Integrating the terms within the brackets, we get the expression as,
\[\Rightarrow \left[ x-\dfrac{{{x}^{2}}}{2} \right]_{-2}^{1}+\left[ \dfrac{{{x}^{2}}}{2}-x \right]_{1}^{4}\]
Putting the intervals as the value of ‘x’, we get,
\[\Rightarrow \left[ \left( 1-\dfrac{1}{2} \right)-\left( \left( -2 \right)-\dfrac{4}{2} \right) \right]+\left[ \left( \dfrac{16}{2}-4 \right)-\left( \dfrac{1}{2}-1 \right) \right]\]
We will now solve the given expression and we get the value of the expression as,
\[\Rightarrow \left[ \left( \dfrac{1}{2} \right)-\left( \dfrac{-4-4}{2} \right) \right]+\left[ \left( 8-4 \right)-\left( -\dfrac{1}{2} \right) \right]\]
Solving further, we have the expression as,
\[\Rightarrow \left[ \left( \dfrac{1}{2} \right)-\left( \dfrac{-8}{2} \right) \right]+\left[ \left( 4 \right)+\left( \dfrac{1}{2} \right) \right]\]
Adding up the terms by taking the LCM, we get,
\[\Rightarrow \left[ \left( \dfrac{1+8}{2} \right) \right]+\left[ \left( \dfrac{8+1}{2} \right) \right]\]
\[\Rightarrow \left[ \left( \dfrac{9}{2} \right) \right]+\left[ \left( \dfrac{9}{2} \right) \right]\]
We get the value of the integral as,
\[\Rightarrow \dfrac{9}{2}+\dfrac{9}{2}=9sq.units\]
This integral value that we have obtained is the area of the region bounded by the lines within the interval -2 to 4, that is,
Note: The modulus function consists of both positive and negative values. So, before plotting a modulus function on a graph it is necessary to consider all the possible equations that the function can have without the modulus. Also, the plotting of the graph can be done without taking all the points and taking the intercept point of x and y axis’.
Recently Updated Pages
Master Class 12 Business Studies: Engaging Questions & Answers for Success
Master Class 12 Biology: Engaging Questions & Answers for Success
Master Class 12 Chemistry: Engaging Questions & Answers for Success
Class 12 Question and Answer - Your Ultimate Solutions Guide
Master Class 11 Social Science: Engaging Questions & Answers for Success
Master Class 11 English: Engaging Questions & Answers for Success
Trending doubts
Which is more stable and why class 12 chemistry CBSE
Which are the Top 10 Largest Countries of the World?
Draw a labelled sketch of the human eye class 12 physics CBSE
Differentiate between homogeneous and heterogeneous class 12 chemistry CBSE
What are the major means of transport Explain each class 12 social science CBSE
Sulphuric acid is known as the king of acids State class 12 chemistry CBSE