


How do you sketch the curve $f\left( x \right)=\dfrac{{{e}^{x}}}{1+{{e}^{x}}}$?
Answer
558.3k+ views
Hint: Now to find the graph of the curve we will find the first derivative of the function and check if the function is increasing or decreasing. Now we will again differentiate to find the second derivative and find if the function is concave upwards or concave downwards. Now we will also find the t intercept by substituting x = 0 and hence we can easily draw a graph of the given function.
Complete step by step solution:
Now let us consider the given function $f\left( x \right)=\dfrac{{{e}^{x}}}{1+{{e}^{x}}}$
First let us check the nature of the function.
Now we will check if the function is increasing or decreasing.
Now we know that if $f\left( x \right)=\dfrac{g}{h}$ then $f'\left( x \right)=\dfrac{hg'-gh'}{{{h}^{2}}}$
Hence using this we get,
$f'\left( x \right)=\dfrac{{{e}^{x}}\left( 1+{{e}^{x}} \right)-{{e}^{x}}\left( {{e}^{x}} \right)}{{{\left( 1+{{e}^{x}} \right)}^{2}}}$
Hence we get,
\[\begin{align}
& \Rightarrow f'\left( x \right)=\dfrac{{{e}^{x}}\left( 1+{{e}^{x}}-{{e}^{x}} \right)}{{{\left( 1+{{e}^{x}} \right)}^{2}}} \\
& \Rightarrow f'\left( x \right)=\dfrac{{{e}^{x}}}{\left( 1+{{e}^{x}} \right)} \\
\end{align}\]
Hence we can say that $f'\left( x \right)>0$ for all x.
Now let us check the second derivative of the function. Hence again differentiating the function we get,
$\begin{align}
& \Rightarrow f''\left( x \right)=\dfrac{{{e}^{x}}{{\left( 1+{{e}^{x}} \right)}^{2}}-2{{e}^{x}}\left( 1+{{e}^{x}} \right)}{{{\left( 1+{{e}^{x}} \right)}^{4}}} \\
& \Rightarrow f''\left( x \right)=\dfrac{{{e}^{x}}\left( 1+{{e}^{x}} \right)\left[ 1+{{e}^{x}}-2 \right]}{{{\left( 1+{{e}^{x}} \right)}^{4}}} \\
\end{align}$
$\Rightarrow f''\left( x \right)=\dfrac{{{e}^{x}}\left( {{e}^{x}}-1 \right)}{\left( 1+{{e}^{x}} \right)}$
Now we know that ${{e}^{x}}>1,x<0$ and ${{e}^{x}}<1,x>0$
Hence $f''\left( x \right)>0$ for $x\in \left( -\infty ,0 \right)$ and $f''\left( x \right)<0$ for $x\in \left( 0,\infty \right)$
Hence function is concave upwards for $x\in \left( -\infty ,0 \right)$ and the function is concave downwards for $x\in \left( 0,\infty \right)$
Now we on substituting x = 0 in the given function we get,
$\Rightarrow f\left( x \right)=\dfrac{{{e}^{0}}}{1+{{e}^{0}}}=\dfrac{1}{2}$
Hence the point (0, 0.5) lies on the graph and is the y intercept of the graph.
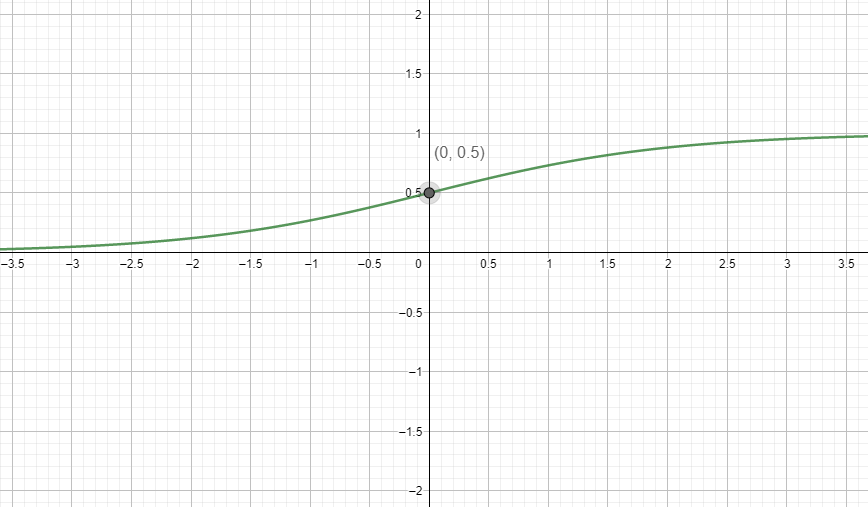
Hence now we have a general idea of the graph. Now plotting according to the obtained conditions we get the graphs as,
Note: Now note that here we got the function as purely increasing. It is possible that the function is increasing and decreasing depending on the intervals taken. Hence we can find these intervals in the first derivative test itself. Also note that if the first derivative is 0 then we get an extrema in the function.
Complete step by step solution:
Now let us consider the given function $f\left( x \right)=\dfrac{{{e}^{x}}}{1+{{e}^{x}}}$
First let us check the nature of the function.
Now we will check if the function is increasing or decreasing.
Now we know that if $f\left( x \right)=\dfrac{g}{h}$ then $f'\left( x \right)=\dfrac{hg'-gh'}{{{h}^{2}}}$
Hence using this we get,
$f'\left( x \right)=\dfrac{{{e}^{x}}\left( 1+{{e}^{x}} \right)-{{e}^{x}}\left( {{e}^{x}} \right)}{{{\left( 1+{{e}^{x}} \right)}^{2}}}$
Hence we get,
\[\begin{align}
& \Rightarrow f'\left( x \right)=\dfrac{{{e}^{x}}\left( 1+{{e}^{x}}-{{e}^{x}} \right)}{{{\left( 1+{{e}^{x}} \right)}^{2}}} \\
& \Rightarrow f'\left( x \right)=\dfrac{{{e}^{x}}}{\left( 1+{{e}^{x}} \right)} \\
\end{align}\]
Hence we can say that $f'\left( x \right)>0$ for all x.
Now let us check the second derivative of the function. Hence again differentiating the function we get,
$\begin{align}
& \Rightarrow f''\left( x \right)=\dfrac{{{e}^{x}}{{\left( 1+{{e}^{x}} \right)}^{2}}-2{{e}^{x}}\left( 1+{{e}^{x}} \right)}{{{\left( 1+{{e}^{x}} \right)}^{4}}} \\
& \Rightarrow f''\left( x \right)=\dfrac{{{e}^{x}}\left( 1+{{e}^{x}} \right)\left[ 1+{{e}^{x}}-2 \right]}{{{\left( 1+{{e}^{x}} \right)}^{4}}} \\
\end{align}$
$\Rightarrow f''\left( x \right)=\dfrac{{{e}^{x}}\left( {{e}^{x}}-1 \right)}{\left( 1+{{e}^{x}} \right)}$
Now we know that ${{e}^{x}}>1,x<0$ and ${{e}^{x}}<1,x>0$
Hence $f''\left( x \right)>0$ for $x\in \left( -\infty ,0 \right)$ and $f''\left( x \right)<0$ for $x\in \left( 0,\infty \right)$
Hence function is concave upwards for $x\in \left( -\infty ,0 \right)$ and the function is concave downwards for $x\in \left( 0,\infty \right)$
Now we on substituting x = 0 in the given function we get,
$\Rightarrow f\left( x \right)=\dfrac{{{e}^{0}}}{1+{{e}^{0}}}=\dfrac{1}{2}$
Hence the point (0, 0.5) lies on the graph and is the y intercept of the graph.
Hence now we have a general idea of the graph. Now plotting according to the obtained conditions we get the graphs as,
Note: Now note that here we got the function as purely increasing. It is possible that the function is increasing and decreasing depending on the intervals taken. Hence we can find these intervals in the first derivative test itself. Also note that if the first derivative is 0 then we get an extrema in the function.
Recently Updated Pages
Basicity of sulphurous acid and sulphuric acid are
Master Class 12 English: Engaging Questions & Answers for Success
Master Class 12 Social Science: Engaging Questions & Answers for Success
Master Class 12 Maths: Engaging Questions & Answers for Success
Master Class 12 Economics: Engaging Questions & Answers for Success
Master Class 12 Physics: Engaging Questions & Answers for Success
Trending doubts
Which are the Top 10 Largest Countries of the World?
Draw a labelled sketch of the human eye class 12 physics CBSE
Draw ray diagrams each showing i myopic eye and ii class 12 physics CBSE
Giving reasons state the signs positive or negative class 12 physics CBSE
Explain esterification reaction with the help of a class 12 chemistry CBSE
What is defined as a solenoid Depict a diagram with class 12 physics CBSE