


How can I read a band of stability graphs?
Answer
593.4k+ views
Hint: The band of stability graph is referred to as the plot of protons and neutrons which make stable combinations to form a nucleus. The graph gives the information for the stability of the isotopes of an element.
Complete step by step answer:
The stability graph dictates the stability of the nucleus of an atom. It indicates whether the combination of protons and neutrons inside a nucleus form a stable atom or not.
The nucleus is composed of protons and neutrons. The number of protons and neutrons inside the nucleus should balance each other so that the nucleus becomes stable. The imbalance of either of the protons or neutrons makes the nucleus radioactive. This then undergoes decay of the nucleus.
In the band of stability graph the number of neutrons is plotted along the x-axis and the number of protons is plotted along the y-axis. The numbers of the neutrons and protons for respective elements are plotted to give a graph of the nuclear stability. The plot looks as follows:
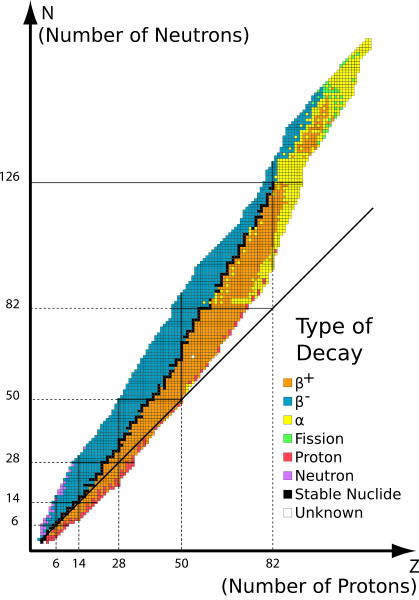
From the plot it seemed that the plot is constant upwards. The black squared line in the middle is where the nucleus is stable. The number of protons and neutrons increase gradually. A little off balance from the line marked as coloured makes the nucleus unstable and results in beta or alpha decay.
After the point containing the number of protons equal to \[82\] protons and the number of neutrons equal to \[126\] the isotopes of the elements are all unstable. At the beginning of the plot the number of neutrons and protons are the same. But as the number of protons increases the line becomes steep with an angle. It also indicates that more neutrons can stick together and make the nucleus stable.
Note:
The stability of the nucleus only lies in the line and apart from the line the nucleus decays. This arises both due to an increase in either number of protons or neutrons. The colors show the unstable nuclei.
Complete step by step answer:
The stability graph dictates the stability of the nucleus of an atom. It indicates whether the combination of protons and neutrons inside a nucleus form a stable atom or not.
The nucleus is composed of protons and neutrons. The number of protons and neutrons inside the nucleus should balance each other so that the nucleus becomes stable. The imbalance of either of the protons or neutrons makes the nucleus radioactive. This then undergoes decay of the nucleus.
In the band of stability graph the number of neutrons is plotted along the x-axis and the number of protons is plotted along the y-axis. The numbers of the neutrons and protons for respective elements are plotted to give a graph of the nuclear stability. The plot looks as follows:
From the plot it seemed that the plot is constant upwards. The black squared line in the middle is where the nucleus is stable. The number of protons and neutrons increase gradually. A little off balance from the line marked as coloured makes the nucleus unstable and results in beta or alpha decay.
After the point containing the number of protons equal to \[82\] protons and the number of neutrons equal to \[126\] the isotopes of the elements are all unstable. At the beginning of the plot the number of neutrons and protons are the same. But as the number of protons increases the line becomes steep with an angle. It also indicates that more neutrons can stick together and make the nucleus stable.
Note:
The stability of the nucleus only lies in the line and apart from the line the nucleus decays. This arises both due to an increase in either number of protons or neutrons. The colors show the unstable nuclei.
Recently Updated Pages
Master Class 12 Business Studies: Engaging Questions & Answers for Success
Master Class 12 Chemistry: Engaging Questions & Answers for Success
Master Class 12 Biology: Engaging Questions & Answers for Success
Class 12 Question and Answer - Your Ultimate Solutions Guide
Master Class 11 English: Engaging Questions & Answers for Success
Master Class 11 Social Science: Engaging Questions & Answers for Success
Trending doubts
Differentiate between Pyramid of energy and pyramid class 12 biology CBSE
Draw the diagram of the pyramid of energy Explain In class 12 biology CBSE
When was the first election held in India a 194748 class 12 sst CBSE
The first microscope was invented by A Leeuwenhoek class 12 biology CBSE
Suicide bags of cells are aEndoplasmic reticulum bLysosome class 12 biology CBSE
The first general election of Lok Sabha was held in class 12 social science CBSE