


Plot the graph of ${{\cos }^{-1}}\left( \cos x \right)$ and write its domain and range.
Answer
647.4k+ views
Hint: In this question, we will first understand the relation of $\cos x$ and ${{\cos }^{-1}}x$. Then, observe the graph of $\cos x$, and how they change sign and use it to plot a graph of ${{\cos }^{-1}}\left( \cos x \right)$. From the graph, we will find its range and domain.
Complete step-by-step answer:
Firstly, let us understand what is meant by the inverse function of cosine.
Suppose, $y={{\cos }^{-1}}x$.
Then, for each value of $x$ there will exist some value of $y$. Then, the cosine inverse of this value of $y$ will be $x$.
For example, $\dfrac{1}{2}=\cos \dfrac{\pi }{6}$.
Then, ${{\cos }^{-1}}\dfrac{1}{2}=\dfrac{\pi }{6}$.
Now, $\cos x$ is a periodic function with period $2\pi $, which means its values repeat in the same pattern after $2\pi $ increases in $x$. That is, $\cos x=\cos \left( 2\pi +x \right)$.
Since, $\cos x$ is periodic with period $2\pi $. Therefore, ${{\cos }^{-1}}\left( \cos x \right)$ is also period with period $2\pi $.
Also, the domain here is set of those values of $x$ for which ${{\cos }^{-1}}\left( \cos x \right)$ is defined. And, range is the set of values where ${{\cos }^{-1}}\left( \cos x \right)$ lies.
Now, for all real values of $x$, $\cos x$lies between -1 and 1. And, between -1 and 1, the inverse function of cosine is defined. Therefore, ${{\cos }^{-1}}\left( \cos x \right)$ is defined for all real values of $x$. Hence, the domain of ${{\cos }^{-1}}\left( \cos x \right)$ is $\left( -\infty ,\infty \right)$ .
We know, graph of $y=\cos x$ is:
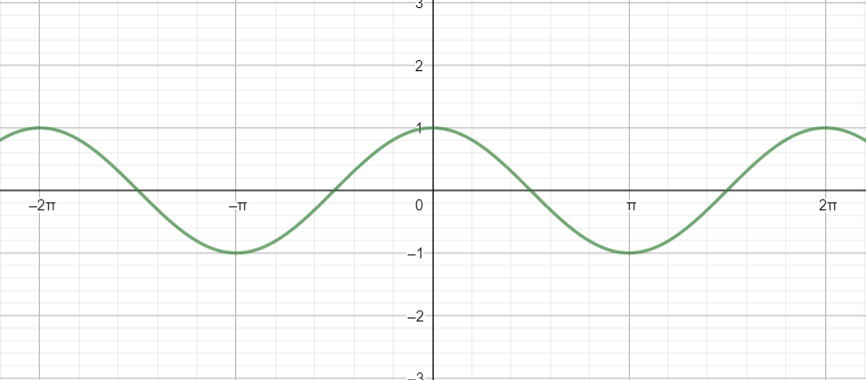
We see that, in the interval $\left[ -\pi ,\pi \right]$, for two different values of $x$, we have the same value of $y$.
Also, from definition of cosine inverse, in this graph, we get,
${{\cos }^{-1}}y=x$
If we substitute $y=\cos x$ here, we get,
${{\cos }^{-1}}\left( \cos x \right)=x$
Now, in graph of ${{\cos }^{-1}}\left( \cos x \right)$, we have,
$y={{\cos }^{-1}}\left( \cos x \right)$
$\Rightarrow y=x$
But, in interval $\left[ -\pi ,\pi \right]$, for two different values of $x$, we have the same value of $y$.
Let those two different values be represented by ${{y}_{1}},{{y}_{2}}$.
Now, as $x$ increases from $-\pi $ to 0, $\cos x$ increases from -1 to 1, and hence, ${{\cos }^{-1}}\left( \cos x \right)$ decreases from $\pi $ to 0. Therefore, here we will have, ${{y}_{1}}=-x$.
And as $x$ increases from 0 to $\pi $, $\cos x$ decreases from 1 to -1, and hence, ${{\cos }^{-1}}\left( \cos x \right)$ increases from 0 to$\pi $. Therefore, here we will have, ${{y}_{2}}=x$.
Also, from $-\pi $ to $\pi $, length of interval is $2\pi $ and ${{\cos }^{-1}}\left( \cos x \right)$ periodic with period $2\pi $. Therefore, the rest of the graph will repeat the same as in the interval $\left[ -\pi ,\pi \right]$.
Hence, the graph of ${{\cos }^{-1}}\left( \cos x \right)$ is given by:
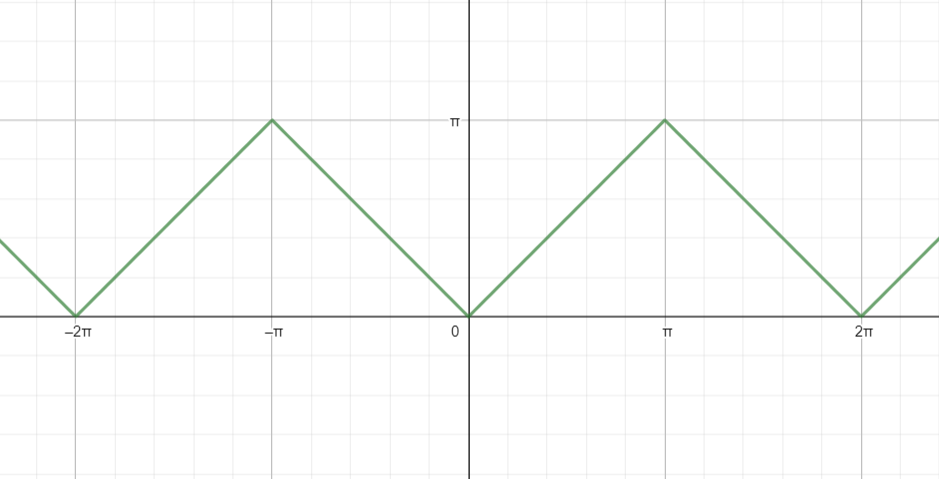
Here, values of ${{\cos }^{-1}}\left( \cos x \right)$ lies between 0 to $\pi $.
Hence for the graph of ${{\cos }^{-1}}\left( \cos x \right)$ plotted above, the domain is $\left( -\infty ,\infty \right)$ and the range is $\left[ 0,\pi \right]$.
Note: While plotting the graph, keep in mind that for two different values of $x$, ${{\cos }^{-1}}\left( \cos x \right)$ will have the same value in interval of length $2\pi $. So, looking at $y=x$, do not directly plot a graph of an infinite straight line.
Complete step-by-step answer:
Firstly, let us understand what is meant by the inverse function of cosine.
Suppose, $y={{\cos }^{-1}}x$.
Then, for each value of $x$ there will exist some value of $y$. Then, the cosine inverse of this value of $y$ will be $x$.
For example, $\dfrac{1}{2}=\cos \dfrac{\pi }{6}$.
Then, ${{\cos }^{-1}}\dfrac{1}{2}=\dfrac{\pi }{6}$.
Now, $\cos x$ is a periodic function with period $2\pi $, which means its values repeat in the same pattern after $2\pi $ increases in $x$. That is, $\cos x=\cos \left( 2\pi +x \right)$.
Since, $\cos x$ is periodic with period $2\pi $. Therefore, ${{\cos }^{-1}}\left( \cos x \right)$ is also period with period $2\pi $.
Also, the domain here is set of those values of $x$ for which ${{\cos }^{-1}}\left( \cos x \right)$ is defined. And, range is the set of values where ${{\cos }^{-1}}\left( \cos x \right)$ lies.
Now, for all real values of $x$, $\cos x$lies between -1 and 1. And, between -1 and 1, the inverse function of cosine is defined. Therefore, ${{\cos }^{-1}}\left( \cos x \right)$ is defined for all real values of $x$. Hence, the domain of ${{\cos }^{-1}}\left( \cos x \right)$ is $\left( -\infty ,\infty \right)$ .
We know, graph of $y=\cos x$ is:
We see that, in the interval $\left[ -\pi ,\pi \right]$, for two different values of $x$, we have the same value of $y$.
Also, from definition of cosine inverse, in this graph, we get,
${{\cos }^{-1}}y=x$
If we substitute $y=\cos x$ here, we get,
${{\cos }^{-1}}\left( \cos x \right)=x$
Now, in graph of ${{\cos }^{-1}}\left( \cos x \right)$, we have,
$y={{\cos }^{-1}}\left( \cos x \right)$
$\Rightarrow y=x$
But, in interval $\left[ -\pi ,\pi \right]$, for two different values of $x$, we have the same value of $y$.
Let those two different values be represented by ${{y}_{1}},{{y}_{2}}$.
Now, as $x$ increases from $-\pi $ to 0, $\cos x$ increases from -1 to 1, and hence, ${{\cos }^{-1}}\left( \cos x \right)$ decreases from $\pi $ to 0. Therefore, here we will have, ${{y}_{1}}=-x$.
And as $x$ increases from 0 to $\pi $, $\cos x$ decreases from 1 to -1, and hence, ${{\cos }^{-1}}\left( \cos x \right)$ increases from 0 to$\pi $. Therefore, here we will have, ${{y}_{2}}=x$.
Also, from $-\pi $ to $\pi $, length of interval is $2\pi $ and ${{\cos }^{-1}}\left( \cos x \right)$ periodic with period $2\pi $. Therefore, the rest of the graph will repeat the same as in the interval $\left[ -\pi ,\pi \right]$.
Hence, the graph of ${{\cos }^{-1}}\left( \cos x \right)$ is given by:
Here, values of ${{\cos }^{-1}}\left( \cos x \right)$ lies between 0 to $\pi $.
Hence for the graph of ${{\cos }^{-1}}\left( \cos x \right)$ plotted above, the domain is $\left( -\infty ,\infty \right)$ and the range is $\left[ 0,\pi \right]$.
Note: While plotting the graph, keep in mind that for two different values of $x$, ${{\cos }^{-1}}\left( \cos x \right)$ will have the same value in interval of length $2\pi $. So, looking at $y=x$, do not directly plot a graph of an infinite straight line.
Recently Updated Pages
Master Class 12 Economics: Engaging Questions & Answers for Success
Master Class 12 English: Engaging Questions & Answers for Success
Master Class 12 Social Science: Engaging Questions & Answers for Success
Master Class 12 Maths: Engaging Questions & Answers for Success
Master Class 12 Physics: Engaging Questions & Answers for Success
Master Class 9 General Knowledge: Engaging Questions & Answers for Success
Trending doubts
Which are the Top 10 Largest Countries of the World?
Draw a labelled sketch of the human eye class 12 physics CBSE
Differentiate between homogeneous and heterogeneous class 12 chemistry CBSE
Why is the cell called the structural and functional class 12 biology CBSE
Draw ray diagrams each showing i myopic eye and ii class 12 physics CBSE
Which is the correct genotypic ratio of mendel dihybrid class 12 biology CBSE