


In the given graph arrow indicates specifically:
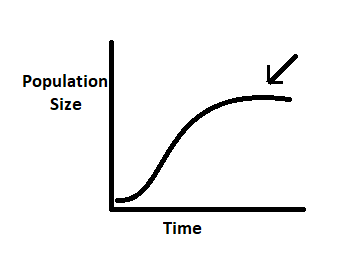
A. r
B. K-N
C. K
D. Density independent effect
Answer
418.2k+ views
Hint: The above graph represents population size v/s time curve. The process of a population's rate of growth slowing as the number of people in the population grows is known as logistic population growth. Here, K is the carrying capacity which is the average population size of the species in a particular habitat.
Complete step-by-step answer:
It is a population growth curve with a logistic or geometric growth pattern.
We can see the graph between population density (N) on the Y-axis and time (t) on the X-axis, which results in a given curve.
The given growth curve represents the relationship between N and t (population density and time) as an exponential or geometric growth of population growth.
As a result, the graph in the diagram represents exponential or geometric increases in the population.
Logistic growth can be thought of as a mathematical equation. The rate of population growth (N) is measured in terms of the total number of people in a population over time (t). The rate of population growth is denoted by $\left ( \dfrac{dN}{dt} \right )$. The d simply represents variation. K represents carrying capacity, and r represents the maximum per capita rate of growth for a population. The word "per capita" refers to an individual, while the per capita growth rate considers both births and deaths in a population. Based on the logistic growth equation, K and r in a population do not change over time.
$\dfrac{dN}{dt}=rN\left ( \dfrac{K-N}{K} \right )$
Hence, the correct option is C
Note: We need to note that logistic growth gives S shape curve whereas exponential growth gives J shaped curve. For population growth to be exponential, the rate of growth must be constant over time.
Recently Updated Pages
Basicity of sulphurous acid and sulphuric acid are
Master Class 12 Economics: Engaging Questions & Answers for Success
Master Class 12 Biology: Engaging Questions & Answers for Success
Master Class 11 English: Engaging Questions & Answers for Success
Master Class 11 Physics: Engaging Questions & Answers for Success
Master Class 11 Computer Science: Engaging Questions & Answers for Success
Trending doubts
What is the Total Duration of Football Match?
What is BLO What is the full form of BLO class 8 social science CBSE
Explain the Treaty of Vienna of 1815 class 10 social science CBSE
Draw a labelled sketch of the human eye class 12 physics CBSE
In football, which nation is called "La Roja"?
Difference Between Plant Cell and Animal Cell