


In the below table, it is given that the growth in height in terms of percentage of the full height of boys and girls with their respective ages. Study the table and draw the line graph of the data given above:
Now, use the graph to answer the following questions:
(i)In which year both the girls and the boys achieve the maximum height?
(ii)Who grows faster at puberty (14 years to 16 years of age)?
Age(in yrs) 8 9 10 11 12 13 14 15 16 17 18 Boys $72\%$ $75\%$ $78\%$ $81\%$ $84\%$ $88\%$ $92\%$ $95\%$ $98\%$ $99\%$ $100\%$ Girls $77\%$ $81\%$ $84\%$ $88\%$ $91\%$ $95\%$ $98\%$ $99\%$ $99.5\%$ $100\%$ $100\%$
| Age(in yrs) | 8 | 9 | 10 | 11 | 12 | 13 | 14 | 15 | 16 | 17 | 18 |
| Boys | $72\%$ | $75\%$ | $78\%$ | $81\%$ | $84\%$ | $88\%$ | $92\%$ | $95\%$ | $98\%$ | $99\%$ | $100\%$ |
| Girls | $77\%$ | $81\%$ | $84\%$ | $88\%$ | $91\%$ | $95\%$ | $98\%$ | $99\%$ | $99.5\%$ | $100\%$ | $100\%$ |
Answer
551.4k+ views
Hint: To solve the above problem, we need to draw the line graph by plotting the percentages of the boys and girls on the y axis and age on the x-axis. Then you need to draw the two separate line graphs on the same graph with percentages of height growth on the y-axis and age (in years) on the x-axis. Then decipher the questions given above from the graph.
Complete step-by-step solution:
The table given in the above problem for boys and girls of different height growth percentage as follows:
Now, first of all, we are going to draw the line graph for the above data in which age is on the x-axis and the percentage growth in height on the y - axis and it will look as follows:
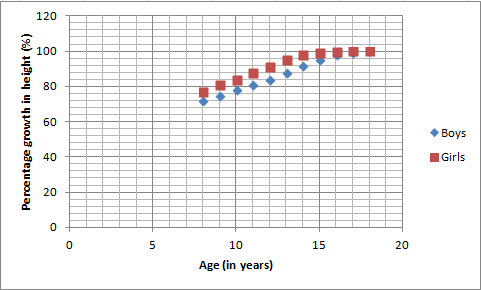
In the above graph, when the girls and boys attain the age of 18 there increase in height is maximum.
Now, according to the information from the above line graph we can infer the answers to the above questions.
In the first part, we have asked to find the year in which the girls and boys attain the maximum height and the answer is 18 years. Hence, the answer for part (i) is 18 years.
In the second part, we are asked whether girls’ or boys’ growth rate is faster in puberty (from 14 years to 16 years). From the graph, as you can see that the girls’ percentage growth in height points rise faster as compared to boys. Hence, the answer is girls.
Note: In the above problem, you can infer better information when you draw the graph of girls and boys on the same graph otherwise if you draw the line graph for girls and boys separately then you cannot properly compare the trend for the two-line graphs.
Complete step-by-step solution:
The table given in the above problem for boys and girls of different height growth percentage as follows:
| Age(in yrs) | 8 | 9 | 10 | 11 | 12 | 13 | 14 | 15 | 16 | 17 | 18 |
| Boys | $72\%$ | $75\%$ | $78\%$ | $81\%$ | $84\%$ | $88\%$ | $92\%$ | $95\%$ | $98\%$ | $99\%$ | $100\%$ |
| Girls | $77\%$ | $81\%$ | $84\%$ | $88\%$ | $91\%$ | $95\%$ | $98\%$ | $99\%$ | $99.5\%$ | $100\%$ | $100\%$ |
Now, first of all, we are going to draw the line graph for the above data in which age is on the x-axis and the percentage growth in height on the y - axis and it will look as follows:
In the above graph, when the girls and boys attain the age of 18 there increase in height is maximum.
Now, according to the information from the above line graph we can infer the answers to the above questions.
In the first part, we have asked to find the year in which the girls and boys attain the maximum height and the answer is 18 years. Hence, the answer for part (i) is 18 years.
In the second part, we are asked whether girls’ or boys’ growth rate is faster in puberty (from 14 years to 16 years). From the graph, as you can see that the girls’ percentage growth in height points rise faster as compared to boys. Hence, the answer is girls.
Note: In the above problem, you can infer better information when you draw the graph of girls and boys on the same graph otherwise if you draw the line graph for girls and boys separately then you cannot properly compare the trend for the two-line graphs.
Recently Updated Pages
Master Class 12 Economics: Engaging Questions & Answers for Success
Master Class 12 English: Engaging Questions & Answers for Success
Master Class 12 Social Science: Engaging Questions & Answers for Success
Master Class 12 Maths: Engaging Questions & Answers for Success
Master Class 12 Physics: Engaging Questions & Answers for Success
Master Class 11 Social Science: Engaging Questions & Answers for Success
Trending doubts
One Metric ton is equal to kg A 10000 B 1000 C 100 class 11 physics CBSE
Difference Between Prokaryotic Cells and Eukaryotic Cells
Two of the body parts which do not appear in MRI are class 11 biology CBSE
1 ton equals to A 100 kg B 1000 kg C 10 kg D 10000 class 11 physics CBSE
Draw a diagram of nephron and explain its structur class 11 biology CBSE
10 examples of friction in our daily life