


In Maxwell velocity distribution curve the peak corresponds to:
(A) RMS velocity
(B) most probable velocity
(C) average velocity
(D) all of these
Answer
607.5k+ views
Hint: we should know why we study Boltzmann-Maxwell distribution of molecular velocity and know to study the graph under this concept, understanding these two points help us to answer this question within no time.
Complete step by step answer:
Due to molecular collision velocity molecules in a gas sample differ continuously as they move in different directions and different velocities. Basically, there will be distribution velocity among the molecules. Based on probability consideration Maxwell Boltzmann gave velocity among the molecules.
\[f(c)dc = 4\pi {(\dfrac{M}{{2\pi RT}})^{\dfrac{3}{2}}}\exp (\dfrac{{ - M{c^2}}}{{2RT}}){c^2}.dc = \dfrac{{dNc}}{N}\]…………………Equation 1
Divide the equation 1 by dc
\[f(c) = 4\pi {(\dfrac{M}{{2\pi RT}})^{\dfrac{3}{2}}}\exp (\dfrac{{ - M{c^2}}}{{2RT}}){c^2} = \dfrac{1}{N}.\dfrac{{dNc}}{{dc}}\]…………………Equation 2
Where, M = Mass of the gas molecule.
C = velocity possessed by gas molecule
dc = small change in the velocity
N = Total number of molecule
$f(c)$= fraction of molecule having velocity between c and $c + dc$
$\dfrac{1}{N}.\dfrac{{dNc}}{{dc}}$ is known as probability density
In order to get the velocity distribution in gas molecules,the probability density versus which gives the velocity distribution in a sample of gas containing N molecules.
Based on the equation 2, three velocities are proposed:
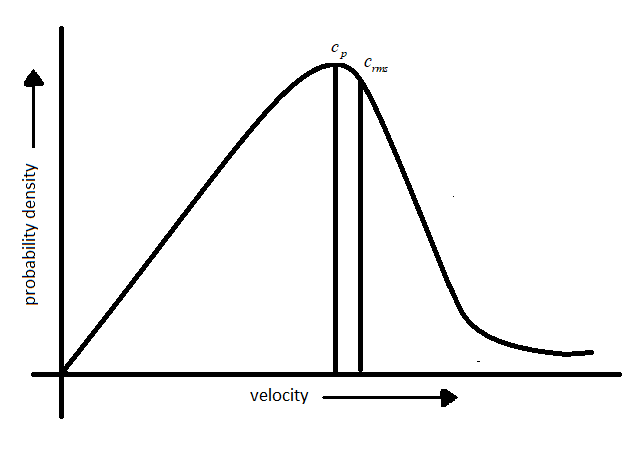
-Most probable velocity: The velocity possessed by maximum number of molecules is represented by most probable velocity which is denoted by$({c_p})$.
-Root means square velocity: The square root of the mean of the square of the different velocities possessed by molecules of a gas at a given temperature and is denoted by (${c_{rms}}$).
-Average velocity: The arithmetic mean of different velocities possessed by the molecules of the gas at a given temperature and is denoted by (${c_{av}}$).
From the definition and graph mentioned above it is evident that the peak of the curve corresponds to most probable velocity.
Thus, option B is the correct answer.
Note: Other observation from the graph:
- Fraction of molecules passing close to zero and very high velocity is very small.
-The area under the curve gives the fraction of molecules having velocity between c and $c + dc$.
-The fraction of molecules possessing higher velocity initially increases and reaches a maximum then declines.
-The probability function will be greater which reflects on the broadness of the curve.
Complete step by step answer:
Due to molecular collision velocity molecules in a gas sample differ continuously as they move in different directions and different velocities. Basically, there will be distribution velocity among the molecules. Based on probability consideration Maxwell Boltzmann gave velocity among the molecules.
\[f(c)dc = 4\pi {(\dfrac{M}{{2\pi RT}})^{\dfrac{3}{2}}}\exp (\dfrac{{ - M{c^2}}}{{2RT}}){c^2}.dc = \dfrac{{dNc}}{N}\]…………………Equation 1
Divide the equation 1 by dc
\[f(c) = 4\pi {(\dfrac{M}{{2\pi RT}})^{\dfrac{3}{2}}}\exp (\dfrac{{ - M{c^2}}}{{2RT}}){c^2} = \dfrac{1}{N}.\dfrac{{dNc}}{{dc}}\]…………………Equation 2
Where, M = Mass of the gas molecule.
C = velocity possessed by gas molecule
dc = small change in the velocity
N = Total number of molecule
$f(c)$= fraction of molecule having velocity between c and $c + dc$
$\dfrac{1}{N}.\dfrac{{dNc}}{{dc}}$ is known as probability density
In order to get the velocity distribution in gas molecules,the probability density versus which gives the velocity distribution in a sample of gas containing N molecules.
Based on the equation 2, three velocities are proposed:
-Most probable velocity: The velocity possessed by maximum number of molecules is represented by most probable velocity which is denoted by$({c_p})$.
-Root means square velocity: The square root of the mean of the square of the different velocities possessed by molecules of a gas at a given temperature and is denoted by (${c_{rms}}$).
-Average velocity: The arithmetic mean of different velocities possessed by the molecules of the gas at a given temperature and is denoted by (${c_{av}}$).
From the definition and graph mentioned above it is evident that the peak of the curve corresponds to most probable velocity.
Thus, option B is the correct answer.
Note: Other observation from the graph:
- Fraction of molecules passing close to zero and very high velocity is very small.
-The area under the curve gives the fraction of molecules having velocity between c and $c + dc$.
-The fraction of molecules possessing higher velocity initially increases and reaches a maximum then declines.
-The probability function will be greater which reflects on the broadness of the curve.
Recently Updated Pages
Master Class 11 Social Science: Engaging Questions & Answers for Success
Master Class 11 English: Engaging Questions & Answers for Success
Master Class 11 Maths: Engaging Questions & Answers for Success
Master Class 11 Chemistry: Engaging Questions & Answers for Success
Master Class 11 Biology: Engaging Questions & Answers for Success
Master Class 11 Physics: Engaging Questions & Answers for Success
Trending doubts
Differentiate between an exothermic and an endothermic class 11 chemistry CBSE
One Metric ton is equal to kg A 10000 B 1000 C 100 class 11 physics CBSE
Difference Between Prokaryotic Cells and Eukaryotic Cells
There are 720 permutations of the digits 1 2 3 4 5 class 11 maths CBSE
Draw a diagram of a plant cell and label at least eight class 11 biology CBSE
Which chemical is known as king of chemicals A H 2 class 11 chemistry CBSE