


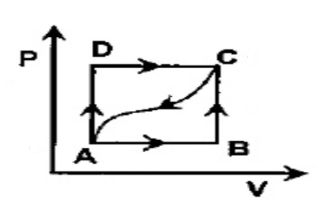
In adjoining P - V diagram, \[100J\] of heat is given in taking a system from A to C along the path ADC and \[50J\] of work is done by the system in this path. How much heat will be absorbed or given out if the work done on the system alone the cured path from C to A is \[15J\]?
A) \[-{\text{ }}65{\text{ }}J\].
B) \[-{\text{ 7}}5{\text{ }}J\]
C) \[-{\text{ 9}}5{\text{ }}J\]
D) \[-{\text{ 11}}5{\text{ }}J\]
Answer
583.2k+ views
Hint:A curve showing variation of volume of substance taken along the X axis and the variation of pressure taken along Y axis is called an indicator diagram.
Complete Step by step answer:
In the adjoining pressure and volume graph of an ideal gas is shown.
-The p-v diagram shows the feature of an idealized.
-The path between each state taking some process from A to D.
-The P –V diagram is taking the ABCD Path.
-From A to C along the path ADC, \[100J\] of heat is given in taking a system.
-In this path \[50J\] of work is done by the system.
-The work done on the system along the curved path from C to A is \[15J\]
Therefore, the heat will be absorbed or given out value is \[ - 65J\].
So, the correct answer is option (A).
Additional information:
-P-V diagram: On the left we have plotted the pressure versus the volume, which is called a p-V diagram.
-In a p-V diagram, from the upper left to the lower right, we say that the lines have a constant temperature curve.
-On this process were performed at the constant temperature is known as isothermal process.
Note:The p-v diagram is originally called indicator diagram.
-The pressure and volume diagram is used to describe corresponding changes in a system.
-The pressure and volume diagram is used to estimate the net work performed by a thermodynamic cycle.
-The total area under the curve on a PV diagram, is we can find the work done by determining.
Recently Updated Pages
Master Class 11 Computer Science: Engaging Questions & Answers for Success
Master Class 11 Business Studies: Engaging Questions & Answers for Success
Master Class 11 Economics: Engaging Questions & Answers for Success
Master Class 11 English: Engaging Questions & Answers for Success
Master Class 11 Maths: Engaging Questions & Answers for Success
Master Class 11 Biology: Engaging Questions & Answers for Success
Trending doubts
One Metric ton is equal to kg A 10000 B 1000 C 100 class 11 physics CBSE
There are 720 permutations of the digits 1 2 3 4 5 class 11 maths CBSE
Discuss the various forms of bacteria class 11 biology CBSE
Draw a diagram of a plant cell and label at least eight class 11 biology CBSE
State the laws of reflection of light
Explain zero factorial class 11 maths CBSE