


In a group of \[50\] people, two tests were conducted, one for diabetes and one for blood pressure, \[30\] people were diagnosed with diabetes and \[40\] people were diagnosed with high blood pressure. What is the minimum number of people who were having diabetes and high blood pressure?
A) \[0\]
B) \[10\]
C) \[20\]
D) \[30\]
Answer
616.2k+ views
Hint: We can solve this problem by using a general substitution method and also using the Venn diagram method. Given in the problem is the information about a number of persons taking two medical tests in a given number of groups of people. We have to find a number of people for the required result by using probability relations. Then, using the formula and given information we can find the number of students who can speak both.
Formula used: We will apply the given into the formula of \[n(D \cup B) + n(D \cap B) = n(D) + n(B)\].
Here,
\[D\] means the number of people who have been diagnosed with diabetes and
\[B\] means the number of people who have been diagnosed with blood pressure.
Complete step-by-step answer:
It is given that; total number of people diagnosed with is \[50\].
Number of people diagnosed with diabetes is \[30\].
Number of people diagnosed with blood pressure is \[40\].
We have to find the number of people who have been diagnosed with both the diseases.
So, as per the given information
\[n(D \cup B) = 50\]
\[n(D) = 30\]
\[n(B) = 40\]
Let us consider the number people who have been diagnosed with both the diseases is \[x\] that is \[n(D \cap B) = x\].
We have to find the value of \[n(D \cap B)\].
We know that,
\[n(D \cup B) + n(D \cap B) = n(D) + n(B)\]
Substitute the values in the above formula we get,
\[\Rightarrow 50 + x = 40 + 30\]
Simplifying we get,
\[\Rightarrow x = 20\]
Hence, the number of people who have been diagnosed with both the diseases is \[20\].
$\therefore $ The correct answer is option C
Note: We can solve the sum by using a Venn diagram.
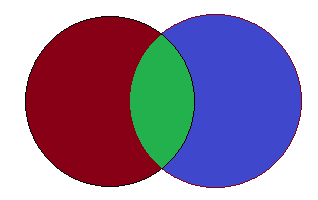
Here, the red shaded part indicates the number of people diagnosed with diabetes is \[30\].
The blue shaded part indicates the number of people diagnosed with blood pressure is \[40\].
The green shaded part indicates the number of people who have been diagnosed with both the diseases.
The total number of people who have been diagnosed with is \[50\].
We have to find the value of the green shaded part.
So, the value of green shaded part is
\[\Rightarrow (40 + 30) - 50 = 20\]
Hence, the number of people who have been diagnosed with both the diseases is \[20\].
Formula used: We will apply the given into the formula of \[n(D \cup B) + n(D \cap B) = n(D) + n(B)\].
Here,
\[D\] means the number of people who have been diagnosed with diabetes and
\[B\] means the number of people who have been diagnosed with blood pressure.
Complete step-by-step answer:
It is given that; total number of people diagnosed with is \[50\].
Number of people diagnosed with diabetes is \[30\].
Number of people diagnosed with blood pressure is \[40\].
We have to find the number of people who have been diagnosed with both the diseases.
So, as per the given information
\[n(D \cup B) = 50\]
\[n(D) = 30\]
\[n(B) = 40\]
Let us consider the number people who have been diagnosed with both the diseases is \[x\] that is \[n(D \cap B) = x\].
We have to find the value of \[n(D \cap B)\].
We know that,
\[n(D \cup B) + n(D \cap B) = n(D) + n(B)\]
Substitute the values in the above formula we get,
\[\Rightarrow 50 + x = 40 + 30\]
Simplifying we get,
\[\Rightarrow x = 20\]
Hence, the number of people who have been diagnosed with both the diseases is \[20\].
$\therefore $ The correct answer is option C
Note: We can solve the sum by using a Venn diagram.
Here, the red shaded part indicates the number of people diagnosed with diabetes is \[30\].
The blue shaded part indicates the number of people diagnosed with blood pressure is \[40\].
The green shaded part indicates the number of people who have been diagnosed with both the diseases.
The total number of people who have been diagnosed with is \[50\].
We have to find the value of the green shaded part.
So, the value of green shaded part is
\[\Rightarrow (40 + 30) - 50 = 20\]
Hence, the number of people who have been diagnosed with both the diseases is \[20\].
Recently Updated Pages
Master Class 12 Economics: Engaging Questions & Answers for Success
Master Class 12 English: Engaging Questions & Answers for Success
Master Class 12 Social Science: Engaging Questions & Answers for Success
Master Class 12 Maths: Engaging Questions & Answers for Success
Master Class 12 Physics: Engaging Questions & Answers for Success
Master Class 9 General Knowledge: Engaging Questions & Answers for Success
Trending doubts
One Metric ton is equal to kg A 10000 B 1000 C 100 class 11 physics CBSE
Difference Between Prokaryotic Cells and Eukaryotic Cells
Find the value of the expression given below sin 30circ class 11 maths CBSE
Two of the body parts which do not appear in MRI are class 11 biology CBSE
Draw a diagram of nephron and explain its structur class 11 biology CBSE
10 examples of friction in our daily life