


If ${\sin ^{ - 1}}{\text{x = y}}$, then
A. $0 \leqslant {\text{y}} \leqslant \pi $
B. $ - \dfrac{\pi }{2} \leqslant {\text{y}} \leqslant \dfrac{\pi }{2}$
C. $0 < {\text{y < }}\pi $
D. $ - \dfrac{\pi }{2} < {\text{y < }}\dfrac{\pi }{2}$
Answer
621k+ views
Hint: To solve this question we will write ${\sin ^{ - 1}}{\text{x = y}}$as ${\text{x = siny}}$and then draw the graph of siny and find the minimum and maximum value of siny and we will find the interval in which y lies.
Complete step by step answer:
Now, we have ${\sin ^{ - 1}}{\text{x = y}}$which can be written as
${\text{x = siny}}$
Now,
At 0, sin y = 0, at $\dfrac{\pi }{2}$, sin y = 0, at $\pi $, sin y = 0. Also, at $ - \dfrac{\pi }{2}$, sin y = -1
So, we will draw the graph of siny according to the above values.
Hint: To solve this question we will write ${\sin ^{ - 1}}{\text{x = y}}$as ${\text{x = siny}}$and then draw the graph of siny and find the minimum and maximum value of siny and we will find the interval in which y lies.
Now, we have ${\sin ^{ - 1}}{\text{x = y}}$which can be written as
${\text{x = siny}}$
Now,
At 0, sin y = 0, at $\dfrac{\pi }{2}$, sin y = 0, at $\pi $, sin y = 0. Also, at $ - \dfrac{\pi }{2}$, sin y = -1
So, we will draw the graph of siny according to the above values.
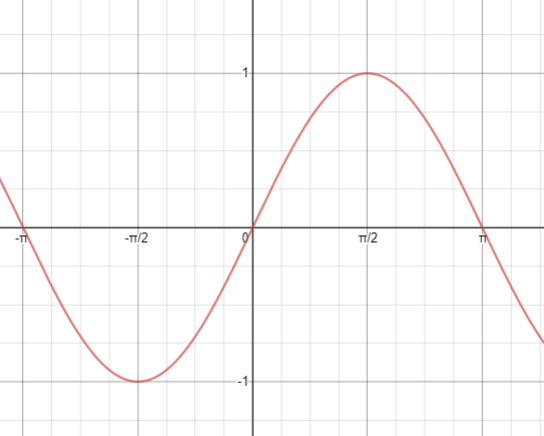
Now, from the graph of ${\text{x = siny}}$, we know that the maximum value of x is 1 and minimum value is -1, i.e.
$ - 1 \leqslant {\text{x}} \leqslant {\text{1}}$
As, ${\text{x = siny}}$, we get
$ - 1 \leqslant \sin {\text{y}} \leqslant {\text{1}}$
Taking the inverse trigonometric function ${\sin ^{ - 1}}$ in the above equation, we get
${\sin ^{ - 1}}( - 1) \leqslant {\sin ^{ - 1}}(\sin {\text{y)}} \leqslant {\text{si}}{{\text{n}}^{ - 1}}(1)$
As, ${\sin ^{ - 1}}( - 1){\text{ = - }}\dfrac{\pi }{2}$ and ${\sin ^{ - 1}}(1){\text{ = }}\dfrac{\pi }{2}$. Also, ${\sin ^{ - 1}}(\sin {\text{x) = x}}$
Therefore, we get
$ - \dfrac{\pi }{2} \leqslant {\text{y}} \leqslant \dfrac{\pi }{2}$
So, option (B) is correct.
Note: When we come up with such types of questions, we will rewrite the given function and remove all inverse functions from the expression. Then we will draw the graph of the expression formed. With the help of the graph drawn, we will find the interval of the function. The interval has extremum values between which the curve of the function oscillates for example the curve of sinx oscillates between -1 and 1 and has a minimum value of -1 and maximum value of 1.
Complete step by step answer:
Now, we have ${\sin ^{ - 1}}{\text{x = y}}$which can be written as
${\text{x = siny}}$
Now,
At 0, sin y = 0, at $\dfrac{\pi }{2}$, sin y = 0, at $\pi $, sin y = 0. Also, at $ - \dfrac{\pi }{2}$, sin y = -1
So, we will draw the graph of siny according to the above values.
Hint: To solve this question we will write ${\sin ^{ - 1}}{\text{x = y}}$as ${\text{x = siny}}$and then draw the graph of siny and find the minimum and maximum value of siny and we will find the interval in which y lies.
Now, we have ${\sin ^{ - 1}}{\text{x = y}}$which can be written as
${\text{x = siny}}$
Now,
At 0, sin y = 0, at $\dfrac{\pi }{2}$, sin y = 0, at $\pi $, sin y = 0. Also, at $ - \dfrac{\pi }{2}$, sin y = -1
So, we will draw the graph of siny according to the above values.
Now, from the graph of ${\text{x = siny}}$, we know that the maximum value of x is 1 and minimum value is -1, i.e.
$ - 1 \leqslant {\text{x}} \leqslant {\text{1}}$
As, ${\text{x = siny}}$, we get
$ - 1 \leqslant \sin {\text{y}} \leqslant {\text{1}}$
Taking the inverse trigonometric function ${\sin ^{ - 1}}$ in the above equation, we get
${\sin ^{ - 1}}( - 1) \leqslant {\sin ^{ - 1}}(\sin {\text{y)}} \leqslant {\text{si}}{{\text{n}}^{ - 1}}(1)$
As, ${\sin ^{ - 1}}( - 1){\text{ = - }}\dfrac{\pi }{2}$ and ${\sin ^{ - 1}}(1){\text{ = }}\dfrac{\pi }{2}$. Also, ${\sin ^{ - 1}}(\sin {\text{x) = x}}$
Therefore, we get
$ - \dfrac{\pi }{2} \leqslant {\text{y}} \leqslant \dfrac{\pi }{2}$
So, option (B) is correct.
Note: When we come up with such types of questions, we will rewrite the given function and remove all inverse functions from the expression. Then we will draw the graph of the expression formed. With the help of the graph drawn, we will find the interval of the function. The interval has extremum values between which the curve of the function oscillates for example the curve of sinx oscillates between -1 and 1 and has a minimum value of -1 and maximum value of 1.
Recently Updated Pages
Basicity of sulphurous acid and sulphuric acid are
Master Class 12 English: Engaging Questions & Answers for Success
Master Class 12 Social Science: Engaging Questions & Answers for Success
Master Class 12 Maths: Engaging Questions & Answers for Success
Master Class 12 Economics: Engaging Questions & Answers for Success
Master Class 12 Physics: Engaging Questions & Answers for Success
Trending doubts
Draw a labelled sketch of the human eye class 12 physics CBSE
Which are the Top 10 Largest Countries of the World?
Draw ray diagrams each showing i myopic eye and ii class 12 physics CBSE
Giving reasons state the signs positive or negative class 12 physics CBSE
Explain esterification reaction with the help of a class 12 chemistry CBSE
What is defined as a solenoid Depict a diagram with class 12 physics CBSE