


How do you graph\[r=1+2\cos \theta \]?
Answer
562.5k+ views
Hint:
In this given question, we have been asked to plot the graph for a given polar form. The polar form of a complex number is the other way to represent a given complex number, the polar form is represented by z = a + bi. When we need to plot the points in the plane, we need to have rectangular coordinate i.e. (x, y). For conversion from polar coordinates to rectangular coordinates, we will need to use the formulas from trigonometric functions. The relation between the polar coordinates \[\left( r,\theta \right)\] and the rectangular coordinates (x, y) is \[x=r\cdot \cos \theta \] and\[y=r\cdot \sin \theta \].
Complete step by step solution:
We have given that,
\[r=1+2\cos \theta \],
Here ‘y’ is represented as \[\theta \], which goes on increasing.
As \[\theta \] increases, the value of ‘r’ goes on decreasing.
Using the trigonometric ratio table;
Put \[\theta =0\], then \[\cos \theta =\cos \left( 0 \right)=1\]
Thus,\[r=1+2\cos \theta =1+2=3\]
\[r=3\]
Put \[\theta =\dfrac{\pi }{2}\], then \[\cos \theta =\cos \left( \dfrac{\pi }{2} \right)=0\]
Thus,\[r=1+2\cos \theta =1+0=1\]
\[r=1\]
Put \[\theta =\pi \], then \[\cos \theta =\cos \left( \pi \right)=-1\]
Thus,\[r=1+2\cos \theta =1-2=-1\]
\[r=-1\]
Put \[\theta =\dfrac{3\pi }{2}\], then \[\cos \theta =\cos \left( \dfrac{3\pi }{2} \right)=0\]
Thus, \[r=1+2\cos \theta =1+0=1\]
\[r=1\]
Put \[\theta =2\pi \], then \[\cos \theta =\cos \left( 2\pi \right)=1\]
Thus, \[r=1+2\cos \theta =1+2=3\]
\[r=3\]
Plotting the graph of all the above respective values or ‘r’.
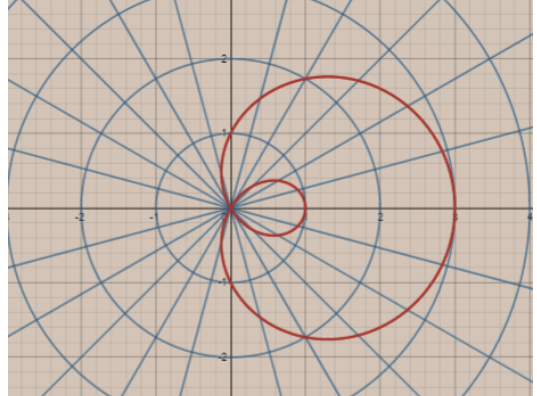
Hence, it is the required graph.
Note:
Students need to remember that polar coordinates are those coordinates that can be plotted into a circular grid. On the other side, rectangular coordinates are those coordinates that can be plotted into a plane i.e. graph and the rectangular coordinates are represented in the form of (x, y). Rectangular coordinates include only numerical values as they represent only horizontal axis and vertical axis. The relation between the polar coordinates \[\left( r,\theta \right)\] and the rectangular coordinates (x, y) is \[x=r\cdot \cos \theta \] and \[y=r\cdot \sin \theta \].
In this given question, we have been asked to plot the graph for a given polar form. The polar form of a complex number is the other way to represent a given complex number, the polar form is represented by z = a + bi. When we need to plot the points in the plane, we need to have rectangular coordinate i.e. (x, y). For conversion from polar coordinates to rectangular coordinates, we will need to use the formulas from trigonometric functions. The relation between the polar coordinates \[\left( r,\theta \right)\] and the rectangular coordinates (x, y) is \[x=r\cdot \cos \theta \] and\[y=r\cdot \sin \theta \].
Complete step by step solution:
We have given that,
\[r=1+2\cos \theta \],
Here ‘y’ is represented as \[\theta \], which goes on increasing.
As \[\theta \] increases, the value of ‘r’ goes on decreasing.
Using the trigonometric ratio table;
| Angles in radian. | \[0\] | \[\dfrac{\pi }{6}\] | \[\dfrac{\pi }{4}\] | \[\dfrac{\pi }{3}\] | \[\dfrac{\pi }{2}\] |
| \[\cos \] | 1 | \[\dfrac{\sqrt{3}}{2}\] | \[\dfrac{\sqrt{2}}{2}\] | \[\dfrac{1}{2}\] | 0 |
Put \[\theta =0\], then \[\cos \theta =\cos \left( 0 \right)=1\]
Thus,\[r=1+2\cos \theta =1+2=3\]
\[r=3\]
Put \[\theta =\dfrac{\pi }{2}\], then \[\cos \theta =\cos \left( \dfrac{\pi }{2} \right)=0\]
Thus,\[r=1+2\cos \theta =1+0=1\]
\[r=1\]
Put \[\theta =\pi \], then \[\cos \theta =\cos \left( \pi \right)=-1\]
Thus,\[r=1+2\cos \theta =1-2=-1\]
\[r=-1\]
Put \[\theta =\dfrac{3\pi }{2}\], then \[\cos \theta =\cos \left( \dfrac{3\pi }{2} \right)=0\]
Thus, \[r=1+2\cos \theta =1+0=1\]
\[r=1\]
Put \[\theta =2\pi \], then \[\cos \theta =\cos \left( 2\pi \right)=1\]
Thus, \[r=1+2\cos \theta =1+2=3\]
\[r=3\]
Plotting the graph of all the above respective values or ‘r’.
Hence, it is the required graph.
Note:
Students need to remember that polar coordinates are those coordinates that can be plotted into a circular grid. On the other side, rectangular coordinates are those coordinates that can be plotted into a plane i.e. graph and the rectangular coordinates are represented in the form of (x, y). Rectangular coordinates include only numerical values as they represent only horizontal axis and vertical axis. The relation between the polar coordinates \[\left( r,\theta \right)\] and the rectangular coordinates (x, y) is \[x=r\cdot \cos \theta \] and \[y=r\cdot \sin \theta \].
Recently Updated Pages
Master Class 12 Social Science: Engaging Questions & Answers for Success
Master Class 12 Physics: Engaging Questions & Answers for Success
Master Class 12 Maths: Engaging Questions & Answers for Success
Master Class 12 Economics: Engaging Questions & Answers for Success
Master Class 12 Chemistry: Engaging Questions & Answers for Success
Master Class 12 Business Studies: Engaging Questions & Answers for Success
Trending doubts
Which are the Top 10 Largest Countries of the World?
Draw a labelled sketch of the human eye class 12 physics CBSE
Explain the structure of megasporangium class 12 biology CBSE
What are the major means of transport Explain each class 12 social science CBSE
How many chromosomes are found in human ovum a 46 b class 12 biology CBSE
The diagram of the section of a maize grain is given class 12 biology CBSE