


How do you graph \[y=\sqrt{x-4}\]?
Answer
554.1k+ views
Hint: First define the given function y by finding its domain, i.e., the values of x for which the function will be defined. To do this, substitute the term inside the square root greater than or equal to 0. Now, to draw the graph, square both sides of the equation and draw the graph of the parabola obtained. Remove the part of the graph below x – axis to get the answer.
Complete step-by-step solution:
Here, we have been provided with the function \[y=\sqrt{x-4}\] and we are asked to draw its graph. But first we need to find the domain of the function.
Now, the domain of a function \[f\left( x \right)\] is the set of values of x for which the function \[f\left( x \right)\] is defined. In the above question, for the function y to be decided we must have the term inside the square root greater than 0. It can be equal to 0 also but not less than 0. So, we must have,
\[\begin{align}
& \Rightarrow x-4\ge 0 \\
& \Rightarrow x\ge 4 \\
\end{align}\]
\[\Rightarrow \] Domain \[\in \left[ 4,\infty \right)\]
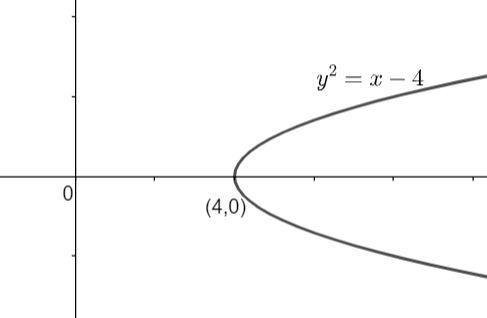
Now, on squaring both sides of the given equation, we get,
\[\Rightarrow {{y}^{2}}=x-4\]
Clearly, we can see that the above relation is a parabola. Here, if we will assume \[{{y}^{2}}=f\left( x \right)=x\] then we can say that the above relation can be written as \[{{y}^{2}}=x-4=f\left( x \right)+c\], where c = -4 units. So, the graph of \[{{y}^{2}}=x-4\] will be shifted 4 units to the right in comparison to the graph of \[{{y}^{2}}=x\]. So, the graph of \[{{y}^{2}}=x-4\] can be given as: -
Now, the original equation is \[y=\sqrt{x-4}\] whose graph we need to draw. As we can see that in the R.H.S. we have the positive square root, so the value of y cannot be negative. That means we need to remove that part of the parabola \[{{y}^{2}}=x-4\] in which y is negative, so the part of the graph below the x – axis needs to be removed. Therefore, we have,
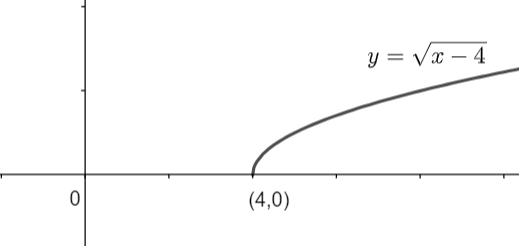
Note: One may note that if we will take values of x less than 4 then the function will become a complex function for which we used another type of plane called ‘argand plane’. Complex functions are not drawn on a cartesian plane. Remember that if you know the graph of \[y=f\left( x \right)\] then you can easily draw the graphs of function \[y=f\left( x \right)+c\]. Here, if ‘c’ is positive then the graph is shifted horizontally left and if ‘c’ is negative then we shift the graph horizontally right.
Complete step-by-step solution:
Here, we have been provided with the function \[y=\sqrt{x-4}\] and we are asked to draw its graph. But first we need to find the domain of the function.
Now, the domain of a function \[f\left( x \right)\] is the set of values of x for which the function \[f\left( x \right)\] is defined. In the above question, for the function y to be decided we must have the term inside the square root greater than 0. It can be equal to 0 also but not less than 0. So, we must have,
\[\begin{align}
& \Rightarrow x-4\ge 0 \\
& \Rightarrow x\ge 4 \\
\end{align}\]
\[\Rightarrow \] Domain \[\in \left[ 4,\infty \right)\]
Now, on squaring both sides of the given equation, we get,
\[\Rightarrow {{y}^{2}}=x-4\]
Clearly, we can see that the above relation is a parabola. Here, if we will assume \[{{y}^{2}}=f\left( x \right)=x\] then we can say that the above relation can be written as \[{{y}^{2}}=x-4=f\left( x \right)+c\], where c = -4 units. So, the graph of \[{{y}^{2}}=x-4\] will be shifted 4 units to the right in comparison to the graph of \[{{y}^{2}}=x\]. So, the graph of \[{{y}^{2}}=x-4\] can be given as: -
Now, the original equation is \[y=\sqrt{x-4}\] whose graph we need to draw. As we can see that in the R.H.S. we have the positive square root, so the value of y cannot be negative. That means we need to remove that part of the parabola \[{{y}^{2}}=x-4\] in which y is negative, so the part of the graph below the x – axis needs to be removed. Therefore, we have,
Note: One may note that if we will take values of x less than 4 then the function will become a complex function for which we used another type of plane called ‘argand plane’. Complex functions are not drawn on a cartesian plane. Remember that if you know the graph of \[y=f\left( x \right)\] then you can easily draw the graphs of function \[y=f\left( x \right)+c\]. Here, if ‘c’ is positive then the graph is shifted horizontally left and if ‘c’ is negative then we shift the graph horizontally right.
Recently Updated Pages
Master Class 11 Computer Science: Engaging Questions & Answers for Success
Master Class 11 Business Studies: Engaging Questions & Answers for Success
Master Class 11 Economics: Engaging Questions & Answers for Success
Master Class 11 English: Engaging Questions & Answers for Success
Master Class 11 Maths: Engaging Questions & Answers for Success
Master Class 11 Biology: Engaging Questions & Answers for Success
Trending doubts
One Metric ton is equal to kg A 10000 B 1000 C 100 class 11 physics CBSE
There are 720 permutations of the digits 1 2 3 4 5 class 11 maths CBSE
Discuss the various forms of bacteria class 11 biology CBSE
Draw a diagram of a plant cell and label at least eight class 11 biology CBSE
State the laws of reflection of light
Explain zero factorial class 11 maths CBSE