


How do you graph $y = {x^2} + 5x + 3?$
Answer
563.4k+ views
Hint:
First of all, convert the given equation into a sum of two variables. Then draw a graph of $y = {x^2}$ and then shift the graph rightward or left according as the term present in the square is subtracted or added with a variable. Then see if there is a constant left in the equation, if yes then shift the graph upward or downward according as the constant is being added or added. You will get the required graph.
Complete step by step solution:
In order to draw the graph of the given equation $y = {x^2} + 5x + 3$ we will first simplify the equation as follows
$
\Rightarrow y = {x^2} + 5x + 3 \\
\Rightarrow y = {x^2} + 2 \times \dfrac{5}{2}x + 3 \\
$
Now, adding and subtracting ${\left( {\dfrac{5}{2}} \right)^2}$ in the right hand side of the equation in order to make a perfect square.
$
\Rightarrow y = {x^2} + 2 \times \dfrac{5}{2}x + {\left( {\dfrac{5}{2}} \right)^2} - {\left( {\dfrac{5}{2}} \right)^2} + 3 \\
\Rightarrow y = {\left( {x + \dfrac{5}{2}} \right)^2} - \dfrac{{25 + 12}}{4} \\
\Rightarrow y = {\left( {x + \dfrac{5}{2}} \right)^2} - \dfrac{{13}}{4} \\
$
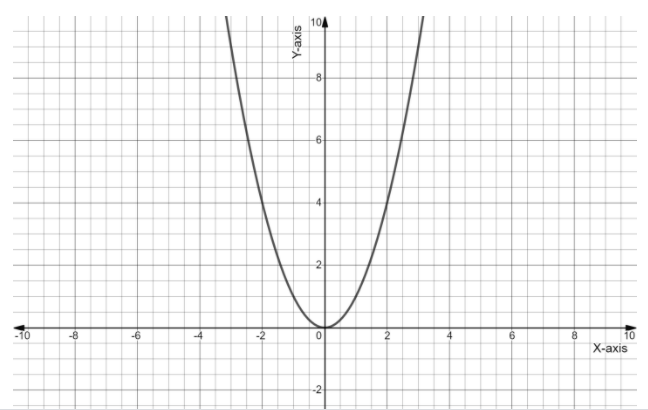
Now, we have simplified the equation in perfect square, so to draw the graph we will first plot the graph of $y = {x^2}$
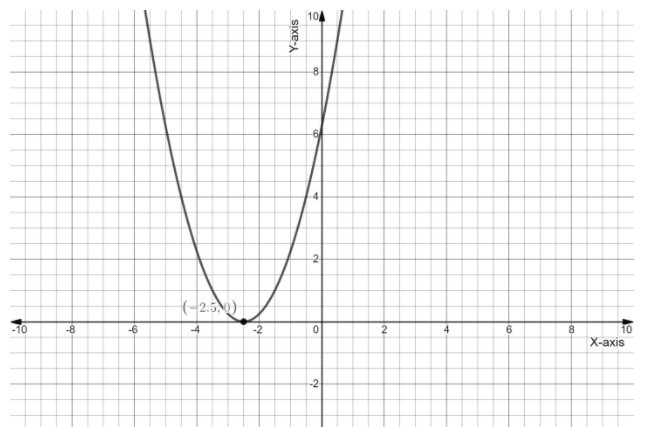
Now if we replace the argument of the function $y = {x^2}$ with $x + \dfrac{5}{2}$ then it will be expressed a $y = {\left( {x + \dfrac{5}{2}} \right)^2}$, since we have added $\dfrac{5}{2}$ in the argument of the function, so we have to shift its graph $\dfrac{5}{2}$ units left as follows
Now, we will subtract $\dfrac{{13}}{4}$ from the equation $y = {\left( {x + \dfrac{5}{2}} \right)^2}$, that is $y = {\left( {x + \dfrac{5}{2}} \right)^2} - \dfrac{{13}}{4}$
So shifting the graph $\dfrac{{13}}{4}$ units downward, we will get
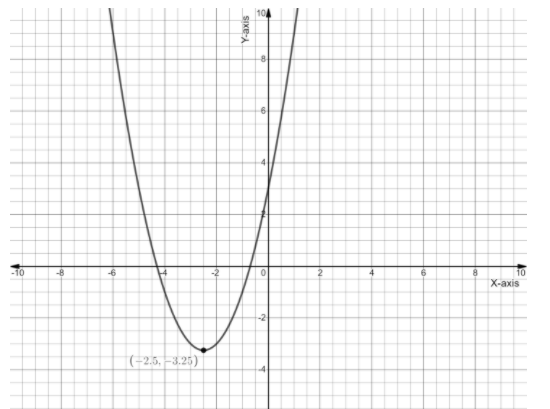
So this is the required graph.
Note:
The graph is being shifted to left or right side when a constant is being added or subtracted from the argument respectively and the graph is being shifted to downward or upward when a constant is being subtracted or added in the output of the equation.
First of all, convert the given equation into a sum of two variables. Then draw a graph of $y = {x^2}$ and then shift the graph rightward or left according as the term present in the square is subtracted or added with a variable. Then see if there is a constant left in the equation, if yes then shift the graph upward or downward according as the constant is being added or added. You will get the required graph.
Complete step by step solution:
In order to draw the graph of the given equation $y = {x^2} + 5x + 3$ we will first simplify the equation as follows
$
\Rightarrow y = {x^2} + 5x + 3 \\
\Rightarrow y = {x^2} + 2 \times \dfrac{5}{2}x + 3 \\
$
Now, adding and subtracting ${\left( {\dfrac{5}{2}} \right)^2}$ in the right hand side of the equation in order to make a perfect square.
$
\Rightarrow y = {x^2} + 2 \times \dfrac{5}{2}x + {\left( {\dfrac{5}{2}} \right)^2} - {\left( {\dfrac{5}{2}} \right)^2} + 3 \\
\Rightarrow y = {\left( {x + \dfrac{5}{2}} \right)^2} - \dfrac{{25 + 12}}{4} \\
\Rightarrow y = {\left( {x + \dfrac{5}{2}} \right)^2} - \dfrac{{13}}{4} \\
$
Now, we have simplified the equation in perfect square, so to draw the graph we will first plot the graph of $y = {x^2}$
Now if we replace the argument of the function $y = {x^2}$ with $x + \dfrac{5}{2}$ then it will be expressed a $y = {\left( {x + \dfrac{5}{2}} \right)^2}$, since we have added $\dfrac{5}{2}$ in the argument of the function, so we have to shift its graph $\dfrac{5}{2}$ units left as follows
Now, we will subtract $\dfrac{{13}}{4}$ from the equation $y = {\left( {x + \dfrac{5}{2}} \right)^2}$, that is $y = {\left( {x + \dfrac{5}{2}} \right)^2} - \dfrac{{13}}{4}$
So shifting the graph $\dfrac{{13}}{4}$ units downward, we will get
So this is the required graph.
Note:
The graph is being shifted to left or right side when a constant is being added or subtracted from the argument respectively and the graph is being shifted to downward or upward when a constant is being subtracted or added in the output of the equation.
Recently Updated Pages
Master Class 12 Social Science: Engaging Questions & Answers for Success
Master Class 12 Physics: Engaging Questions & Answers for Success
Master Class 12 Maths: Engaging Questions & Answers for Success
Master Class 12 Economics: Engaging Questions & Answers for Success
Master Class 12 Chemistry: Engaging Questions & Answers for Success
Master Class 12 Business Studies: Engaging Questions & Answers for Success
Trending doubts
Which are the Top 10 Largest Countries of the World?
Draw a labelled sketch of the human eye class 12 physics CBSE
Explain the structure of megasporangium class 12 biology CBSE
What are the major means of transport Explain each class 12 social science CBSE
Differentiate between homogeneous and heterogeneous class 12 chemistry CBSE
Sulphuric acid is known as the king of acids State class 12 chemistry CBSE