


How do you graph the line \[y = - 4x + 4\] ?
Answer
569.4k+ views
Hint: In the above question, we need to plot the above line on the graph. Since, the given equation is a line where the equation of the straight line is \[y = mx + c\]so we can compare with this equation and find out the coordinates of the line on the cartesian plane.
Complete step by step solution:
In the above equation, we have to plot the line on the graph. To find the coordinates of the line what we can do is to select some values of x coordinate and then evaluate those values in the given equation.
So, now we will have to select a value for x i.e., zero and we substitute the value in \[y = mx + c\] where m is the slope and c is the constant term y-intercept. So, substitute the value in equation we get,
The equation is \[y = - 4x + 4\] .So when \[x = 0\] we get So when \[x = 0\]we get,
\[
\Rightarrow y = 0 + 4 \\
\Rightarrow y = 4 \\
\]
Therefore, we get the y-intercept as 4. The line will cut the Y-axis at point 4.
Now we will select the point y=0.
\[
\Rightarrow 0 = - 4x + 4 \\
\Rightarrow 4x = 4 \\
\Rightarrow x = 1 \\
\]
Therefore, we get x-intercept as 1. The line will cut x-axis at 1.
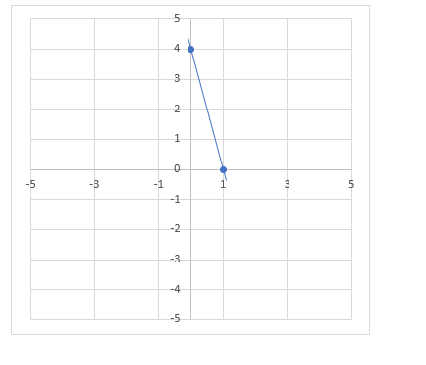
Hence, we plot the points (0,4) and (1,0) on the graph and the line is plotted by joining these points.
Note: An important thing to note is that slope contains the direction in which how you go from one point to another where \[m = \dfrac{y}{x} = \dfrac{{rise}}{{run}}\]. The numerator tells you many steps to go up and down and the denominator tell us how much steps to move left or right.
Complete step by step solution:
In the above equation, we have to plot the line on the graph. To find the coordinates of the line what we can do is to select some values of x coordinate and then evaluate those values in the given equation.
So, now we will have to select a value for x i.e., zero and we substitute the value in \[y = mx + c\] where m is the slope and c is the constant term y-intercept. So, substitute the value in equation we get,
The equation is \[y = - 4x + 4\] .So when \[x = 0\] we get So when \[x = 0\]we get,
\[
\Rightarrow y = 0 + 4 \\
\Rightarrow y = 4 \\
\]
Therefore, we get the y-intercept as 4. The line will cut the Y-axis at point 4.
Now we will select the point y=0.
\[
\Rightarrow 0 = - 4x + 4 \\
\Rightarrow 4x = 4 \\
\Rightarrow x = 1 \\
\]
Therefore, we get x-intercept as 1. The line will cut x-axis at 1.
Hence, we plot the points (0,4) and (1,0) on the graph and the line is plotted by joining these points.
Note: An important thing to note is that slope contains the direction in which how you go from one point to another where \[m = \dfrac{y}{x} = \dfrac{{rise}}{{run}}\]. The numerator tells you many steps to go up and down and the denominator tell us how much steps to move left or right.
Recently Updated Pages
Master Class 11 Social Science: Engaging Questions & Answers for Success
Master Class 11 Physics: Engaging Questions & Answers for Success
Master Class 11 Maths: Engaging Questions & Answers for Success
Master Class 11 Economics: Engaging Questions & Answers for Success
Master Class 11 Computer Science: Engaging Questions & Answers for Success
Master Class 11 Chemistry: Engaging Questions & Answers for Success
Trending doubts
One Metric ton is equal to kg A 10000 B 1000 C 100 class 11 physics CBSE
There are 720 permutations of the digits 1 2 3 4 5 class 11 maths CBSE
1 Quintal is equal to a 110 kg b 10 kg c 100kg d 1000 class 11 physics CBSE
State and prove Bernoullis theorem class 11 physics CBSE
Difference Between Prokaryotic Cells and Eukaryotic Cells
Which among the following are examples of coming together class 11 social science CBSE