


Graphs representing Boyle’s law is (are):
A:

B:

C:

D:

Answer
624.3k+ views
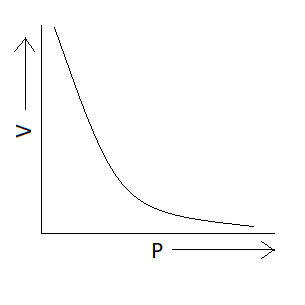
Hint: Boyle’s law states that pressure of a given substance varies inversely with its volume at constant temperature. According to this law $PV = k$ where $P$ is pressure, $V$ is volume and $k$ is a constant. According to this equation the product of pressure and volume is constant.
Complete step by step answer:
We know Boyle's law states that the product of pressure and volume is constant at a given temperature. Now we have to find the option in which graph represents product of pressure and volume constant or we can also say that the option in which pressure varies inversely with volume $\left( {P \propto \dfrac{1}{V}} \right)$ . We know that the graph is exponential if we have quantities that vary inversely with each other. There is only one option which represents an exponential graph and that option is option A. This means correct option is option A that is:
Additional information: Charles’s law tells that for an ideal gas when pressure is constant volume is directly proportional to the temperature. According to this law $PV = nRT$
Where,$P$ is pressure, $V$ is volume, $n$ is number of moles, $R$ is gas constant and $T$ is temperature of gas (in Kelvin).
According to Gay-Lussac’s law at constant volume pressure is directly proportional to the temperature of gas. According to this law $P \propto T$
Where,$P$ is pressure and $T$ is temperature.
Note:
The ideal gas model tends to fail at lower temperatures or higher pressures, when intermolecular forces and molecular size becomes important. It also fails for most heavy gases, such as many refrigerants and for gases with strong intermolecular forces, notably water vapour.
Recently Updated Pages
Master Class 12 Economics: Engaging Questions & Answers for Success
Master Class 12 English: Engaging Questions & Answers for Success
Master Class 12 Social Science: Engaging Questions & Answers for Success
Master Class 12 Maths: Engaging Questions & Answers for Success
Master Class 12 Physics: Engaging Questions & Answers for Success
Master Class 11 Social Science: Engaging Questions & Answers for Success
Trending doubts
One Metric ton is equal to kg A 10000 B 1000 C 100 class 11 physics CBSE
Difference Between Prokaryotic Cells and Eukaryotic Cells
Two of the body parts which do not appear in MRI are class 11 biology CBSE
1 ton equals to A 100 kg B 1000 kg C 10 kg D 10000 class 11 physics CBSE
Draw a diagram of nephron and explain its structur class 11 biology CBSE
10 examples of friction in our daily life