


How do you graph $y=\sin x+1$ over the interval $0\le x\le 360$?
Answer
561.3k+ views
Hint:We first try to plot the graph for $y=\sin x$. Then we find the graph for $y=\sin x+1$ by pulling the graph line of $y=-\cos x$ up by 1 unit. The curve will be for the whole real line. We only take the solution for $0\le x\le 360$.
Complete step by step solution:
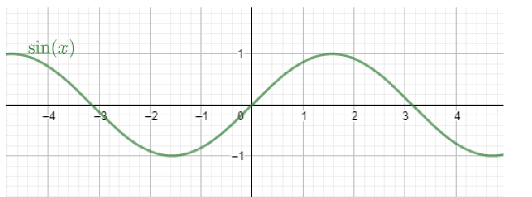
The usual common graph which is easier to plot on the graph is $y=\sin x$.
The graph is an oscillating graph with boundary being $-1$ and 1.
The domain for the graph $y=\sin x$ is $\forall x\in \mathbb{R}$.
The range for the graph $y=\sin x$ is $\left[ -1,1 \right]$.
The change between $y=\sin x$ and $y=\sin x+1$ is that for a particular value of $x$, we are going to find the value of $y$ being 1 greater than the previous value for $y=\sin x$.
This means that we are going to ascend the graph with respect to the previous graph line which is for $y=\sin x$ at the time of changing the graph from $y=\sin x$ to $y=\sin x+1$.
The domain for the graph $y=\sin x+1$ is $\forall x\in \mathbb{R}$.
The range for the graph $y=\sin x+1$ is $\left[ 0,2 \right]$.
Now we need to bound the graph in between $0\le x\le 360$. The marked graph portion is the required area. The curved line in that area is the required graph of $y=\sin x+1$.
Note: We need to be careful about the change from $y=\sin x$ to $y=\sin x+1$. The lowering or ascending of the graph is dependent on the constant value that is being added. If the value is positive then graph ascends and if the value is negative then it descends.
Complete step by step solution:
The usual common graph which is easier to plot on the graph is $y=\sin x$.
The graph is an oscillating graph with boundary being $-1$ and 1.
The domain for the graph $y=\sin x$ is $\forall x\in \mathbb{R}$.
The range for the graph $y=\sin x$ is $\left[ -1,1 \right]$.
The change between $y=\sin x$ and $y=\sin x+1$ is that for a particular value of $x$, we are going to find the value of $y$ being 1 greater than the previous value for $y=\sin x$.
This means that we are going to ascend the graph with respect to the previous graph line which is for $y=\sin x$ at the time of changing the graph from $y=\sin x$ to $y=\sin x+1$.
The domain for the graph $y=\sin x+1$ is $\forall x\in \mathbb{R}$.
The range for the graph $y=\sin x+1$ is $\left[ 0,2 \right]$.
Now we need to bound the graph in between $0\le x\le 360$. The marked graph portion is the required area. The curved line in that area is the required graph of $y=\sin x+1$.
Note: We need to be careful about the change from $y=\sin x$ to $y=\sin x+1$. The lowering or ascending of the graph is dependent on the constant value that is being added. If the value is positive then graph ascends and if the value is negative then it descends.
Recently Updated Pages
Basicity of sulphurous acid and sulphuric acid are
Master Class 11 Business Studies: Engaging Questions & Answers for Success
Master Class 11 Computer Science: Engaging Questions & Answers for Success
Master Class 11 Economics: Engaging Questions & Answers for Success
Master Class 11 Social Science: Engaging Questions & Answers for Success
Master Class 11 English: Engaging Questions & Answers for Success
Trending doubts
Draw a diagram of nephron and explain its structur class 11 biology CBSE
Explain zero factorial class 11 maths CBSE
Chemical formula of Bleaching powder is A Ca2OCl2 B class 11 chemistry CBSE
Name the part of the brain responsible for the precision class 11 biology CBSE
The growth of tendril in pea plants is due to AEffect class 11 biology CBSE
One Metric ton is equal to kg A 10000 B 1000 C 100 class 11 physics CBSE