


How do you graph \[y=\sec \left( x-\dfrac{\pi }{4} \right)\]?
Answer
605.1k+ views
Hint: to find the graph for the given equation, we have to use \[y=a\sec \left( bx-c \right)+d\] for finding the amplitude, period, phase shift, vertical shift. After finding these values we have to find some points to plot on the graph. Now, based on the amplitude, period, vertical shift and phase shift and some more points we will draw a graph for the given equation.
Complete step by step answer:
From the given question we are given a graph for the equation \[y=\sec \left( x-\dfrac{\pi }{4} \right)\].
To draw a graph for the equation let us consider the above equation as equation (1).
Let us consider
\[y=\sec \left( x-\dfrac{\pi }{4} \right).........\left( 1 \right)\]
To draw the graph for equation (1), we have to use the equation \[y=a\sec \left( bx-c \right)+d\] to find the variables used to find the amplitude, period, phase shift, and vertical shift.
So let us consider the equation as equation (2).
\[y=a\sec \left( bx-c \right)+d...........\left( 2 \right)\]
By comparing equation (1) and (2), we get
\[\begin{align}
& \Rightarrow a=1.............\left( 3 \right) \\
& \Rightarrow b=1..............\left( 4 \right) \\
& \Rightarrow c=\dfrac{\pi }{4}.............\left( 5 \right) \\
& \Rightarrow d=0..............\left( 6 \right) \\
\end{align}\]
Now let us consider the above equations as equation (3), equation (4), equation (5) and equation (6) respectively.
Since the graph of the function \[\sec \] does not have a maximum or minimum value, therefore we can say that amplitude will become none.
Amplitude: None
Now let us find the period using the formula \[\dfrac{2\pi }{\left| b \right|}\].
Now from the equation (4) let us find the period for equation (1)
Therefore,
Period of equation (1) is \[2\pi \]
Let us consider
Period = \[2\pi ...............\left( 7 \right)\]
Let us find the phase shift using the formula \[\dfrac{c}{x}\].
Now from the equation (5) let us find the vertical shift for equation (1).
Therefore,
Phase shift of equation (1) is \[\dfrac{\pi }{4}\].
Let us consider
Phase shift = \[\dfrac{\pi }{4}..............\left( 8 \right)\].
Let us find a vertical shift from the formula d.
As we know from equation (6) we can say that vertical shift is equal to \[0\].
Therefore, let us consider
Vertical shift = \[0.................\left( 9 \right)\].
Now we can say that graphs of equation (1) can be graphed using amplitude, period, phase shift, vertical shift, and the points.
Selecting a few points to graph,
Therefore from equation (7), (8), (9) and above points we get
Note:
To find a graph for the equation \[y=\sec \left( x-\dfrac{\pi }{4} \right)\], we should be aware of graphs concept in trigonometry. We should be careful while comparing the given equation with \[y=a\sec \left( bx-c \right)+d\]. Students should avoid calculation mistakes while doing this problem.
Complete step by step answer:
From the given question we are given a graph for the equation \[y=\sec \left( x-\dfrac{\pi }{4} \right)\].
To draw a graph for the equation let us consider the above equation as equation (1).
Let us consider
\[y=\sec \left( x-\dfrac{\pi }{4} \right).........\left( 1 \right)\]
To draw the graph for equation (1), we have to use the equation \[y=a\sec \left( bx-c \right)+d\] to find the variables used to find the amplitude, period, phase shift, and vertical shift.
So let us consider the equation as equation (2).
\[y=a\sec \left( bx-c \right)+d...........\left( 2 \right)\]
By comparing equation (1) and (2), we get
\[\begin{align}
& \Rightarrow a=1.............\left( 3 \right) \\
& \Rightarrow b=1..............\left( 4 \right) \\
& \Rightarrow c=\dfrac{\pi }{4}.............\left( 5 \right) \\
& \Rightarrow d=0..............\left( 6 \right) \\
\end{align}\]
Now let us consider the above equations as equation (3), equation (4), equation (5) and equation (6) respectively.
Since the graph of the function \[\sec \] does not have a maximum or minimum value, therefore we can say that amplitude will become none.
Amplitude: None
Now let us find the period using the formula \[\dfrac{2\pi }{\left| b \right|}\].
Now from the equation (4) let us find the period for equation (1)
Therefore,
Period of equation (1) is \[2\pi \]
Let us consider
Period = \[2\pi ...............\left( 7 \right)\]
Let us find the phase shift using the formula \[\dfrac{c}{x}\].
Now from the equation (5) let us find the vertical shift for equation (1).
Therefore,
Phase shift of equation (1) is \[\dfrac{\pi }{4}\].
Let us consider
Phase shift = \[\dfrac{\pi }{4}..............\left( 8 \right)\].
Let us find a vertical shift from the formula d.
As we know from equation (6) we can say that vertical shift is equal to \[0\].
Therefore, let us consider
Vertical shift = \[0.................\left( 9 \right)\].
Now we can say that graphs of equation (1) can be graphed using amplitude, period, phase shift, vertical shift, and the points.
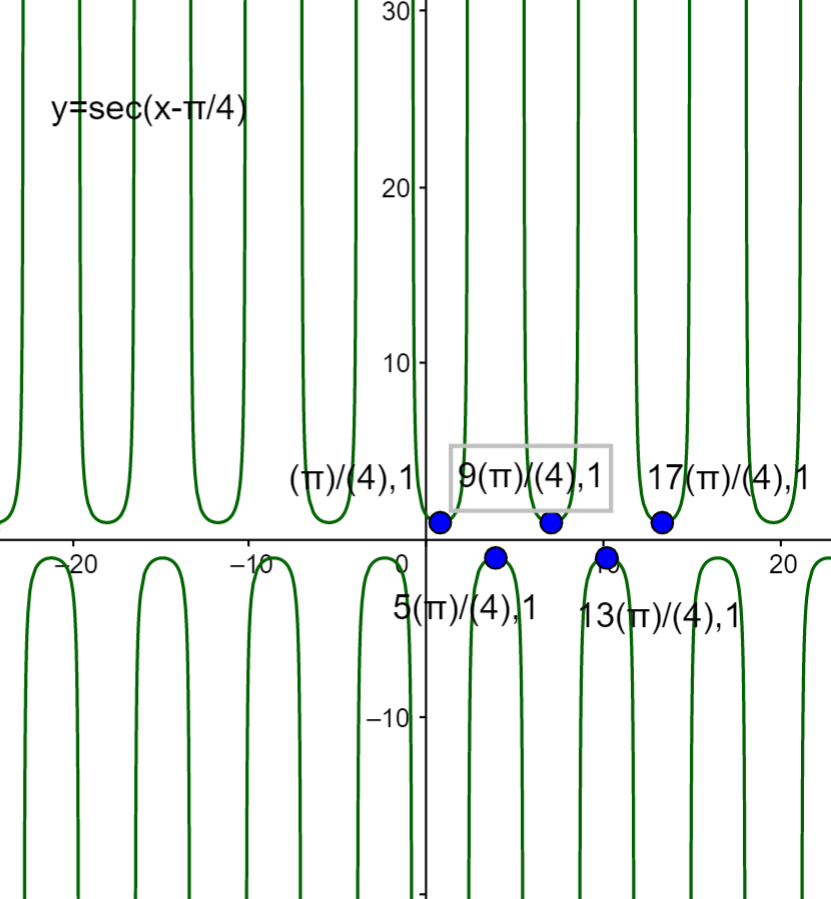
Selecting a few points to graph,
| \[x\] | \[\text{f(x)}\] |
| \[\dfrac{\pi }{4}\text{ }\] | \[1\] |
| \[\dfrac{5\pi }{4}\] | \[-1\] |
| \[\dfrac{9\pi }{4}\text{ }\] | \[1\] |
| \[\dfrac{13\pi }{4}\] | \[-1\] |
| \[\dfrac{17\pi }{4}\] | \[1\] |
Therefore from equation (7), (8), (9) and above points we get
Note:
To find a graph for the equation \[y=\sec \left( x-\dfrac{\pi }{4} \right)\], we should be aware of graphs concept in trigonometry. We should be careful while comparing the given equation with \[y=a\sec \left( bx-c \right)+d\]. Students should avoid calculation mistakes while doing this problem.
Recently Updated Pages
Basicity of sulphurous acid and sulphuric acid are
Master Class 11 English: Engaging Questions & Answers for Success
Master Class 11 Physics: Engaging Questions & Answers for Success
Master Class 11 Computer Science: Engaging Questions & Answers for Success
Master Class 11 Chemistry: Engaging Questions & Answers for Success
Master Class 11 Social Science: Engaging Questions & Answers for Success
Trending doubts
One Metric ton is equal to kg A 10000 B 1000 C 100 class 11 physics CBSE
Draw a diagram of nephron and explain its structur class 11 biology CBSE
What will happen if the mucus is not secreted by the class 11 biology CBSE
Draw a diagram of a plant cell and label at least eight class 11 biology CBSE
What is the purity of pure gold in carat class 11 chemistry CBSE
Lysosomes are known as suicidal bags of cell why class 11 biology CBSE