


How do you graph $y = x\sin \left( {\dfrac{1}{x}} \right)$?
Answer
579.9k+ views
Hint: This problem deals with plotting the graph of $x$ and $\sin \dfrac{1}{x}$ together. The line $y = x$ is similar to the straight line $y = mx$, where the slope of the line is 1, and it passes through the origin as it has no intercept, also when considered to plot the graph on the negative side of the x-axis, then the line becomes $y = - x$, here the slope of the line becomes negative which is equal to -1. We know that graph of $\sin x$, we are going to combine these graphs.
Complete step-by-step solution:
As we know that the graph of sin(x) limits between -1 and 1, which is mathematically expressed below:
$ \Rightarrow \sin x \in \left[ { - 1,1} \right]$
Now we have to find the graph of $\sin \dfrac{1}{x}$, here the function of sine changed, but the trigonometric function didn’t change, so the graph of $\sin \dfrac{1}{x}$ also limits between -1 and 1.
But before $\sin \dfrac{1}{x}$, there is $x$ in front of $\sin \dfrac{1}{x}$.
Here the $x$ prior to $\sin \dfrac{1}{x}$ behaves as a scaling factor. As $x$ grows large, the amplitude of the oscillation of the sine function also grows. Similarly, as $x$ approaches zero, the amplitude shrinks.
Now looking at $\sin \dfrac{1}{x}$, we observe that as $x$ approaches zero, $\dfrac{1}{x}$ approaches $\infty $. Which means that as $x \to 0$, the sine function cycles through periods of $2\pi $ more and more rapidly.
Similarly, as $\dfrac{1}{x} \to 0$, here $x \to \pm \infty $, meaning that it will take greater and greater changes in $x$ to go through a full period of $2\pi $.
After $\left| x \right| > \dfrac{1}{\pi }$ there will be no further oscillations, as we will have $\left| {\dfrac{1}{x}} \right| \in \left( {0,\pi } \right)$.
The resulting graph will have oscillations which grow in amplitude and are stretched further apart as $x$ is further from zero, soon ceasing to oscillate at all, and which have smaller amplitudes and wilder oscillations closer to zero.
The graph of $y = x\sin \left( {\dfrac{1}{x}} \right)$ is given below:
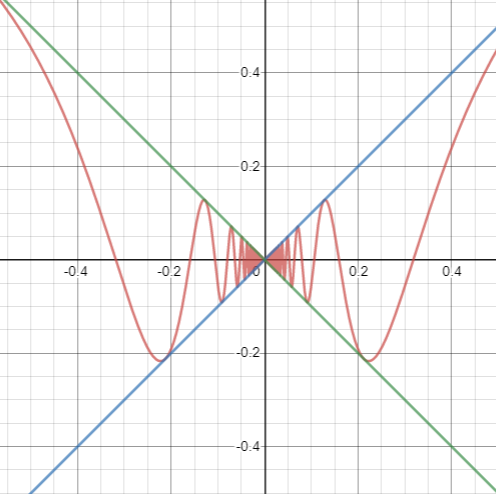
Note: Here we know that $y = x$ passes through origin with positive slope and $y = - x$ also passes through the origin but with negative slope, and the graph $y = \sin \dfrac{1}{x}$, starts from zero, where is oscillates between 1 and -1, but here as $x$ and $\sin \dfrac{1}{x}$ come together, so the graph oscillates between the lines $y = x$ and $y = - x$
Complete step-by-step solution:
As we know that the graph of sin(x) limits between -1 and 1, which is mathematically expressed below:
$ \Rightarrow \sin x \in \left[ { - 1,1} \right]$
Now we have to find the graph of $\sin \dfrac{1}{x}$, here the function of sine changed, but the trigonometric function didn’t change, so the graph of $\sin \dfrac{1}{x}$ also limits between -1 and 1.
But before $\sin \dfrac{1}{x}$, there is $x$ in front of $\sin \dfrac{1}{x}$.
Here the $x$ prior to $\sin \dfrac{1}{x}$ behaves as a scaling factor. As $x$ grows large, the amplitude of the oscillation of the sine function also grows. Similarly, as $x$ approaches zero, the amplitude shrinks.
Now looking at $\sin \dfrac{1}{x}$, we observe that as $x$ approaches zero, $\dfrac{1}{x}$ approaches $\infty $. Which means that as $x \to 0$, the sine function cycles through periods of $2\pi $ more and more rapidly.
Similarly, as $\dfrac{1}{x} \to 0$, here $x \to \pm \infty $, meaning that it will take greater and greater changes in $x$ to go through a full period of $2\pi $.
After $\left| x \right| > \dfrac{1}{\pi }$ there will be no further oscillations, as we will have $\left| {\dfrac{1}{x}} \right| \in \left( {0,\pi } \right)$.
The resulting graph will have oscillations which grow in amplitude and are stretched further apart as $x$ is further from zero, soon ceasing to oscillate at all, and which have smaller amplitudes and wilder oscillations closer to zero.
The graph of $y = x\sin \left( {\dfrac{1}{x}} \right)$ is given below:
Note: Here we know that $y = x$ passes through origin with positive slope and $y = - x$ also passes through the origin but with negative slope, and the graph $y = \sin \dfrac{1}{x}$, starts from zero, where is oscillates between 1 and -1, but here as $x$ and $\sin \dfrac{1}{x}$ come together, so the graph oscillates between the lines $y = x$ and $y = - x$
Recently Updated Pages
Master Class 12 Social Science: Engaging Questions & Answers for Success
Master Class 12 Physics: Engaging Questions & Answers for Success
Master Class 12 Maths: Engaging Questions & Answers for Success
Master Class 12 Economics: Engaging Questions & Answers for Success
Master Class 12 Chemistry: Engaging Questions & Answers for Success
Master Class 12 Business Studies: Engaging Questions & Answers for Success
Trending doubts
Which are the Top 10 Largest Countries of the World?
Draw a labelled sketch of the human eye class 12 physics CBSE
Explain the structure of megasporangium class 12 biology CBSE
What are the major means of transport Explain each class 12 social science CBSE
How many chromosomes are found in human ovum a 46 b class 12 biology CBSE
The diagram of the section of a maize grain is given class 12 biology CBSE