


How do you graph $y = \dfrac{1}{3}x + 2$ by plotting points?
Answer
563.7k+ views
Hint: Here, in this question we are asked to graph the line $y = \dfrac{1}{3}x + 2$. Before starting solving the question, we will have to compare it with slope-intercept form i.e., $y = mx + c$. Here, $c = 2$ which means that the intercept on the $y$-axis is $2$ and $m = \dfrac{1}{3}$ which means that the slope of the line is $\dfrac{1}{3}$.
Complete step by step solution:
The given equation of the line is$y = \dfrac{1}{3}x + 2$. We are supposed to put the equation in slope intercept form i.e.,$y = mx + c$. Here, we get $y = \dfrac{1}{3}x + 2$, so we get $m = \dfrac{1}{3}$ and $c = 2$. Now, we will have to make a table of values, which can be done by using different values of $x$.
Here, when we put $x = 3$, we get $y = 3$. So, we get point $\left( {3,3} \right)$. When we put $x = 6$, we get $y = 4$. So, we get point$\left( {6,4} \right)$.
So, now we have points: $\left( {3,3} \right)$,$\left( {6,4} \right)$.
Now, we draw our axes for $x$ and $y$. We have to choose the appropriate scale and mark the values on the $x$ and $y$ axis. Mark all the three points and draw a straight line through these points.
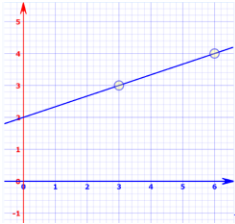
Therefore, we have our required graph.
Note: In order to solve such questions, we first need to analyse what is given to us. The given equation $y = \dfrac{1}{3}x + 2$ is a simple linear equation. To graph a linear equation, we have to draw a line in a $2 - D$ plane. Students should keep in mind that every linear equation represents a straight line. In order to check if the points calculated are correct or not, just put their values in the given equation if L.H.S=R.H.S then, the points are correct.
Complete step by step solution:
The given equation of the line is$y = \dfrac{1}{3}x + 2$. We are supposed to put the equation in slope intercept form i.e.,$y = mx + c$. Here, we get $y = \dfrac{1}{3}x + 2$, so we get $m = \dfrac{1}{3}$ and $c = 2$. Now, we will have to make a table of values, which can be done by using different values of $x$.
Here, when we put $x = 3$, we get $y = 3$. So, we get point $\left( {3,3} \right)$. When we put $x = 6$, we get $y = 4$. So, we get point$\left( {6,4} \right)$.
| $x$ | $3$ | $6$ |
| $y$ | $3$ | $4$ |
| Point $\left( {x,y} \right)$ | $\left( {3,3} \right)$ | $\left( {6,4} \right)$ |
So, now we have points: $\left( {3,3} \right)$,$\left( {6,4} \right)$.
Now, we draw our axes for $x$ and $y$. We have to choose the appropriate scale and mark the values on the $x$ and $y$ axis. Mark all the three points and draw a straight line through these points.
Therefore, we have our required graph.
Note: In order to solve such questions, we first need to analyse what is given to us. The given equation $y = \dfrac{1}{3}x + 2$ is a simple linear equation. To graph a linear equation, we have to draw a line in a $2 - D$ plane. Students should keep in mind that every linear equation represents a straight line. In order to check if the points calculated are correct or not, just put their values in the given equation if L.H.S=R.H.S then, the points are correct.
Recently Updated Pages
Basicity of sulphurous acid and sulphuric acid are
Master Class 11 Business Studies: Engaging Questions & Answers for Success
Master Class 11 Computer Science: Engaging Questions & Answers for Success
Master Class 11 Economics: Engaging Questions & Answers for Success
Master Class 11 Social Science: Engaging Questions & Answers for Success
Master Class 11 English: Engaging Questions & Answers for Success
Trending doubts
One Metric ton is equal to kg A 10000 B 1000 C 100 class 11 physics CBSE
The largest wind power cluster is located in the state class 11 social science CBSE
Explain zero factorial class 11 maths CBSE
State and prove Bernoullis theorem class 11 physics CBSE
Which among the following are examples of coming together class 11 social science CBSE
Can anyone list 10 advantages and disadvantages of friction