


How do you graph \[y = - 3x + 5\] using slope intercept form?
Answer
579.9k+ views
Hint: In this question, we draw a graph using the above equation. The equation which is given above is a straight line equation. In the above equation is an independent variable and y is a dependent variable. For drawing the graph, first we calculate the points and points are calculated as we put the value of x like \[\left( {0,\;1,\;2,.......} \right)\] in the above equation and then find the value of y. then we draw the graph by using these points.
Complete step by step answer:
Now we come to question, in the question the straight-line equation is given as below.
\[ \Rightarrow y = - 3x + 5\]
The slope is \[m = - 3\].
Now we find the points from the above equation.
We put the value of \[x = 0\] in the above equation, and then we find the value of y.
\[
y = - 3 \times 0 + 5 \\
y = 5 \\
\]
The value of y is \[ = 5\]
Then the point is \[\left( {0,\;5} \right)\].
Now, we put the value of \[x = 1\]in the above equation, and then find the value of y.
\[
y = - 3 \times 1 + 5 \\
y = 2 \\
\]
The value of y is \[ = 2\]
Then the point is \[\left( {1,\;2} \right)\].
Then, we put \[x = 2\] in the above equation then \[y = - 1\]. Then the point is \[\left( {2,\; - 1} \right)\].
Hence, we calculate the same for other points.
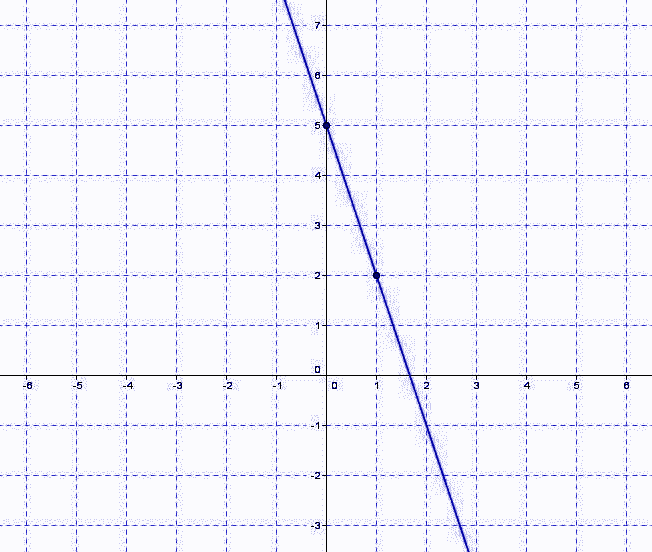
Now we draw the graph by using the points.
The points are \[\left( {\left( {0,\;5} \right),\left( {1,\;2} \right),\left( {2,\; - 1} \right)} \right)\].
Therefore, the graph is drawn as below.
Note:
In this question, we use the word slope intercept form. Slope intercept form is defined as the form of straight-line equation. Slope intercept form is represented as below.
\[ \Rightarrow y = mx + c\]
Where,
\[m = \] Slope
\[c = \] It is y intercept
And x and y are the variable. Where x is an independent variable and y is a dependent variable. When we put the value of x then we find the value of y.
draw the graph.
Complete step by step answer:
Now we come to question, in the question the straight-line equation is given as below.
\[ \Rightarrow y = - 3x + 5\]
The slope is \[m = - 3\].
Now we find the points from the above equation.
We put the value of \[x = 0\] in the above equation, and then we find the value of y.
\[
y = - 3 \times 0 + 5 \\
y = 5 \\
\]
The value of y is \[ = 5\]
Then the point is \[\left( {0,\;5} \right)\].
Now, we put the value of \[x = 1\]in the above equation, and then find the value of y.
\[
y = - 3 \times 1 + 5 \\
y = 2 \\
\]
The value of y is \[ = 2\]
Then the point is \[\left( {1,\;2} \right)\].
Then, we put \[x = 2\] in the above equation then \[y = - 1\]. Then the point is \[\left( {2,\; - 1} \right)\].
Hence, we calculate the same for other points.
Now we draw the graph by using the points.
The points are \[\left( {\left( {0,\;5} \right),\left( {1,\;2} \right),\left( {2,\; - 1} \right)} \right)\].
Therefore, the graph is drawn as below.
Note:
In this question, we use the word slope intercept form. Slope intercept form is defined as the form of straight-line equation. Slope intercept form is represented as below.
\[ \Rightarrow y = mx + c\]
Where,
\[m = \] Slope
\[c = \] It is y intercept
And x and y are the variable. Where x is an independent variable and y is a dependent variable. When we put the value of x then we find the value of y.
draw the graph.
Recently Updated Pages
Master Class 11 Social Science: Engaging Questions & Answers for Success
Master Class 11 English: Engaging Questions & Answers for Success
Master Class 11 Maths: Engaging Questions & Answers for Success
Master Class 11 Chemistry: Engaging Questions & Answers for Success
Master Class 11 Biology: Engaging Questions & Answers for Success
Master Class 11 Physics: Engaging Questions & Answers for Success
Trending doubts
One Metric ton is equal to kg A 10000 B 1000 C 100 class 11 physics CBSE
Difference Between Prokaryotic Cells and Eukaryotic Cells
How many of the following diseases can be studied with class 11 biology CBSE
Which of the following enzymes is used for carboxylation class 11 biology CBSE
Two of the body parts which do not appear in MRI are class 11 biology CBSE
Draw a diagram of a plant cell and label at least eight class 11 biology CBSE