


How do you graph the inequality \[y\underline{>}\dfrac{3}{2}x-3\]?
Answer
580.5k+ views
Hint: Suppose an equation of straight line to be \[y=ax+b\]. We can draw the graph of \[y=ax+b\] from the simple graph \[y=x\]. We need to modify the \[y=x\] graph by shifting and scaling methods. It is a better idea to modify the graph of \[y=x\] in such a manner that we get the required graph by going from left side to right side of the equation \[y=\dfrac{3}{2}x-3\].
Complete step by step answer:
As per the given question, we need to graph a straight line which is given by the equation \[y=\dfrac{3}{2}x-3\].
A straight line can be traced out on the cartesian plane by just two points lying on it. We can also use a third point for sort of check. It is very simple to graph the \[y=x\] line as it is symmetric to both x and y axes.
The graph of \[y=x\] is as shown in below figure:
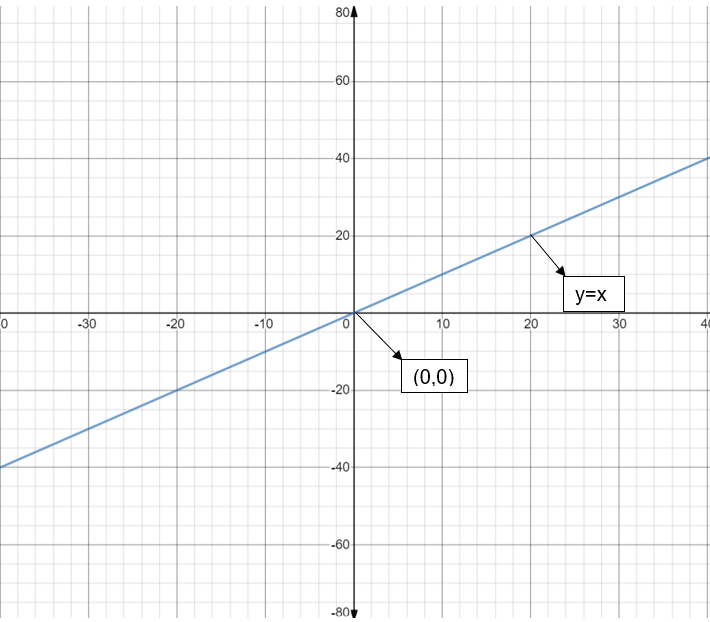
If we go from left hand side to right hand side of the equation \[y=\dfrac{3}{2}x-3\], it is clear that we need to first scale the \[y=x\] graph by a factor \[\dfrac{3}{2}\]. Then we get \[y=\dfrac{3}{2}x\].
And the graph of \[y=\dfrac{3}{2}x\] is as shown in the below figure:
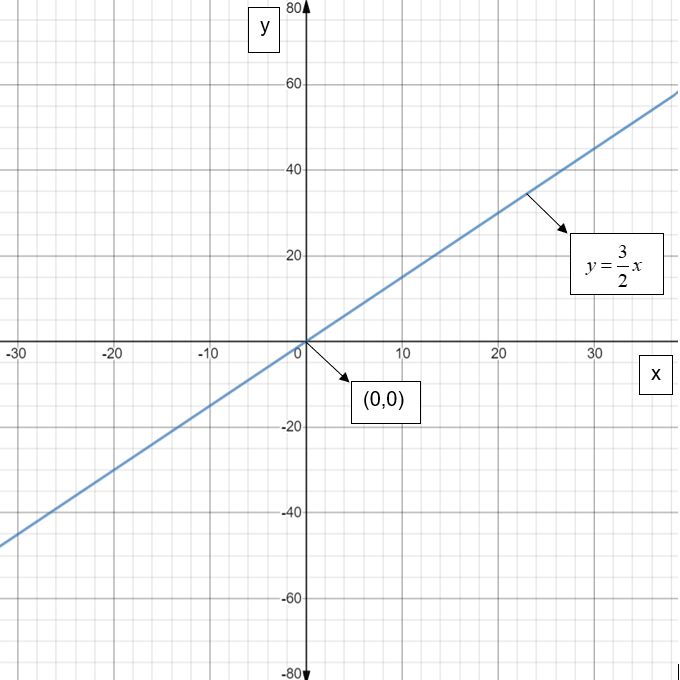
Now, we need to shift the \[y=\dfrac{3}{2}x\] graph right hand side by 3 units to get the required straight line \[y=\dfrac{3}{2}x-3\]. And the graph of \[y=\dfrac{3}{2}x-3\] is shown in the below figure:
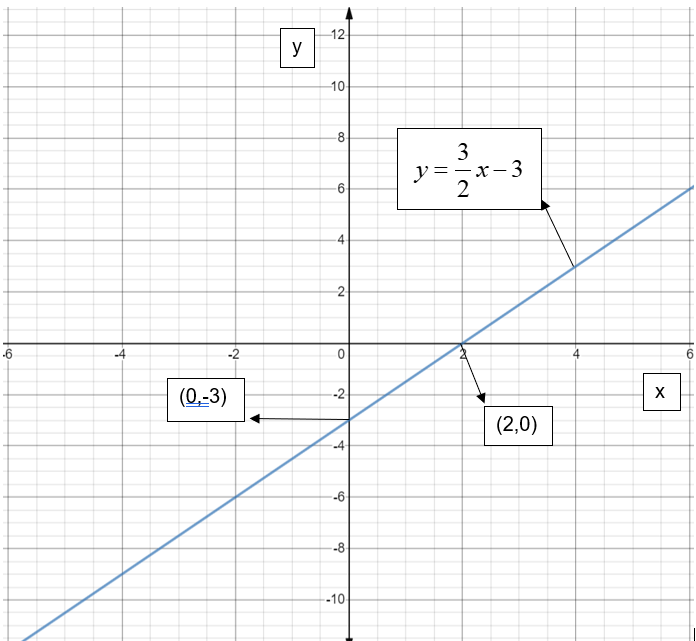
Since we need to plot \[y\underline{>}\dfrac{3}{2}x-3\] we have to shade the part above the line. Thus, it looks like,
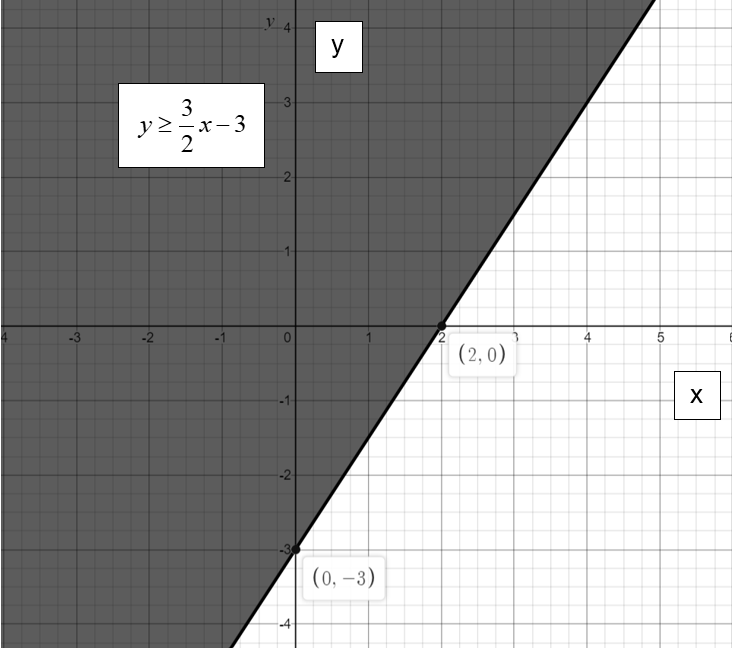
\[\therefore \] we have to compress \[y=x\] by \[\dfrac{3}{2}\] and then shift it to the right hand side by 3 units and shade the part above the line to get the desired plot \[y\underline{>}\dfrac{3}{2}x-3\].
Note:
We can trace the graph of \[y\underline{>}\dfrac{3}{2}x-3\] by substitution by any two random values of x and joining the two random variables with a line. we have to check which part to be shaded depending on the sign given in the problem.
Complete step by step answer:
As per the given question, we need to graph a straight line which is given by the equation \[y=\dfrac{3}{2}x-3\].
A straight line can be traced out on the cartesian plane by just two points lying on it. We can also use a third point for sort of check. It is very simple to graph the \[y=x\] line as it is symmetric to both x and y axes.
The graph of \[y=x\] is as shown in below figure:
If we go from left hand side to right hand side of the equation \[y=\dfrac{3}{2}x-3\], it is clear that we need to first scale the \[y=x\] graph by a factor \[\dfrac{3}{2}\]. Then we get \[y=\dfrac{3}{2}x\].
And the graph of \[y=\dfrac{3}{2}x\] is as shown in the below figure:
Now, we need to shift the \[y=\dfrac{3}{2}x\] graph right hand side by 3 units to get the required straight line \[y=\dfrac{3}{2}x-3\]. And the graph of \[y=\dfrac{3}{2}x-3\] is shown in the below figure:
Since we need to plot \[y\underline{>}\dfrac{3}{2}x-3\] we have to shade the part above the line. Thus, it looks like,
\[\therefore \] we have to compress \[y=x\] by \[\dfrac{3}{2}\] and then shift it to the right hand side by 3 units and shade the part above the line to get the desired plot \[y\underline{>}\dfrac{3}{2}x-3\].
Note:
We can trace the graph of \[y\underline{>}\dfrac{3}{2}x-3\] by substitution by any two random values of x and joining the two random variables with a line. we have to check which part to be shaded depending on the sign given in the problem.
Recently Updated Pages
Master Class 11 Social Science: Engaging Questions & Answers for Success
Master Class 11 English: Engaging Questions & Answers for Success
Master Class 11 Maths: Engaging Questions & Answers for Success
Master Class 11 Chemistry: Engaging Questions & Answers for Success
Master Class 11 Biology: Engaging Questions & Answers for Success
Master Class 11 Physics: Engaging Questions & Answers for Success
Trending doubts
One Metric ton is equal to kg A 10000 B 1000 C 100 class 11 physics CBSE
Difference Between Prokaryotic Cells and Eukaryotic Cells
How many of the following diseases can be studied with class 11 biology CBSE
Draw a diagram of a plant cell and label at least eight class 11 biology CBSE
Two of the body parts which do not appear in MRI are class 11 biology CBSE
Which gas is abundant in air class 11 chemistry CBSE