


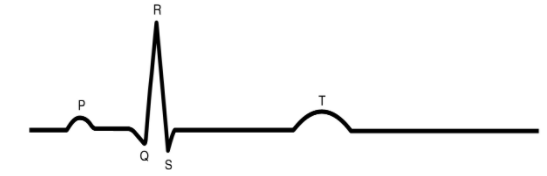
Given here is ECG of a normal human. Which one of its components is correctly interpreted
A) QRS complex-one complete pulse
B) Peak T-initiation of total cardiac contraction
C) Peak P and R-systole and diastole blood pressure
D) Peak T-initiation of left atrial contraction only
Answer
565.5k+ views
Hint: ECG stands for electrocardiogram. It records the electrical signals from the heart in the form of a graph. It is used to check the proper functioning of the heart. It measures the activity of the heart through the electrodes placed on the skin.
Complete answer:
To answer this question, we must know about the ECG graph.
The waves generated in the graph plotted as voltage vs time gives the activity of the graph. The waves generated are P, Q, R, S and T.
A) QR Complex-The QRS complex shows the electrical impulse as it moves from the ventricles and indicates repolarization. It starts just before the ventricular contraction and is the complete pulse. (A correct)
B) T wave- It shows the repolarisation of the ventricles which means the cardiac relaxation takes place.(Incorrect)
C) P wave shows the depolarisation of atrium. R shows the peak of ventricular contraction. The P and R signify a systole. (Incorrect)
D) Peak T shows the diastole which means relaxation of the whole heart. (Incorrect)
Thus the correct answer is option A.
Note: The duration of P wave is less than 80 ms. The PR interval is 120-200 ms. The QRS complex is 80-100ms. The T wave is 160 ms. Cardiac abnormalities cause changes in the normal ECG pattern like coronary heart diseases, electrolyte disturbances, inadequate artery blood flow etc.
Recently Updated Pages
Master Class 11 Computer Science: Engaging Questions & Answers for Success
Master Class 11 Business Studies: Engaging Questions & Answers for Success
Master Class 11 Economics: Engaging Questions & Answers for Success
Master Class 11 English: Engaging Questions & Answers for Success
Master Class 11 Maths: Engaging Questions & Answers for Success
Master Class 11 Biology: Engaging Questions & Answers for Success
Trending doubts
One Metric ton is equal to kg A 10000 B 1000 C 100 class 11 physics CBSE
There are 720 permutations of the digits 1 2 3 4 5 class 11 maths CBSE
Discuss the various forms of bacteria class 11 biology CBSE
Draw a diagram of a plant cell and label at least eight class 11 biology CBSE
State the laws of reflection of light
Explain zero factorial class 11 maths CBSE